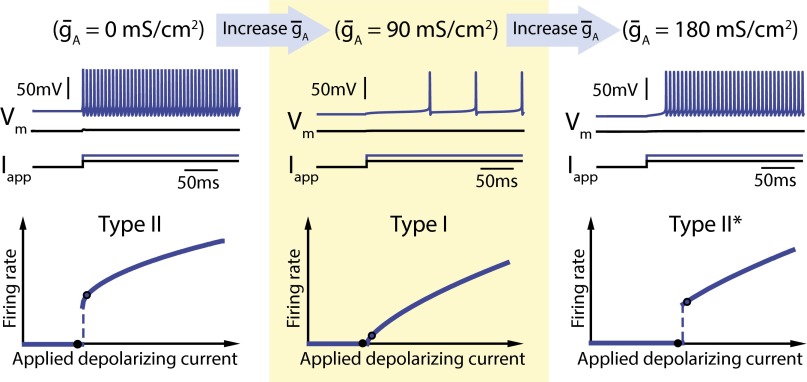
Fig. 1.
Increasing A-type potassium channel density in the Connor–Stevens model switches neuron excitability from Type II to Type I back to Type II*. The three panels show simulation results of the Connor–Stevens model for different values of A-type potassium channel density: (Left) = 0 mS⋅cm−2, (Middle) = 90 mS⋅cm−2, and (Right) = 180 mS⋅cm−2. The top of each panel shows membrane potential (Vm) traces for two different step input currents (Iapp) (black and blue traces). The bottom of each panel shows neuron firing rate as a function of the input current (FI curve). Black points on the FI curves correspond to each of the example traces shown above.

