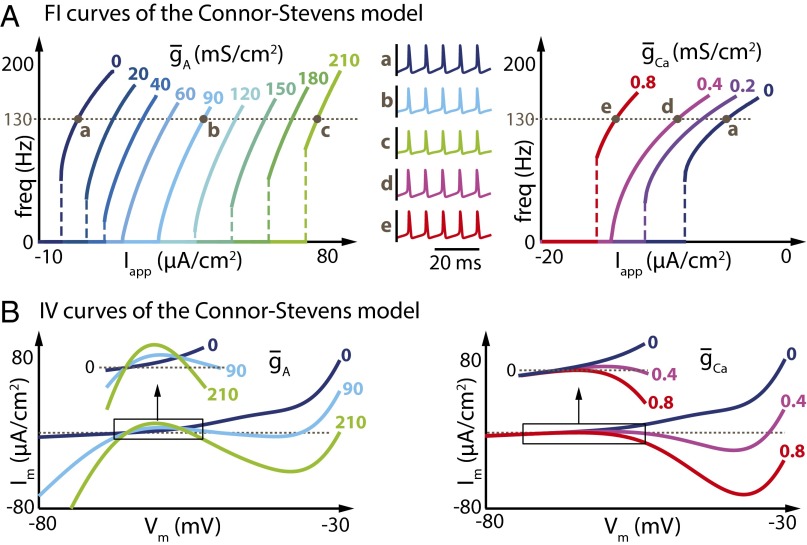
Fig. 2.
Increasing A-type potassium current or L-type calcium current in the Connor–Stevens model has similar effects on the shape of the FI curve but opposite effects on the current threshold. (A) (Left) FI curves of the Connor–Stevens model for different values of ( = 0 mS⋅cm−2). (Right) FI curves of the same Connor-Stevens model for different values of ( = 0 mS⋅cm−2). Specific values of the current densities are depicted above each curve. (Middle) Membrane potential variations over time at a similar frequency in the absence of both and (dark blue trace), for increasing values of (light blue and green traces), and for increasing values of (magenta and red traces). (B) IV curves of the Connor–Stevens model for different values of (Left) and different values of (Right). Specific values of the current densities are depicted on each curve.

