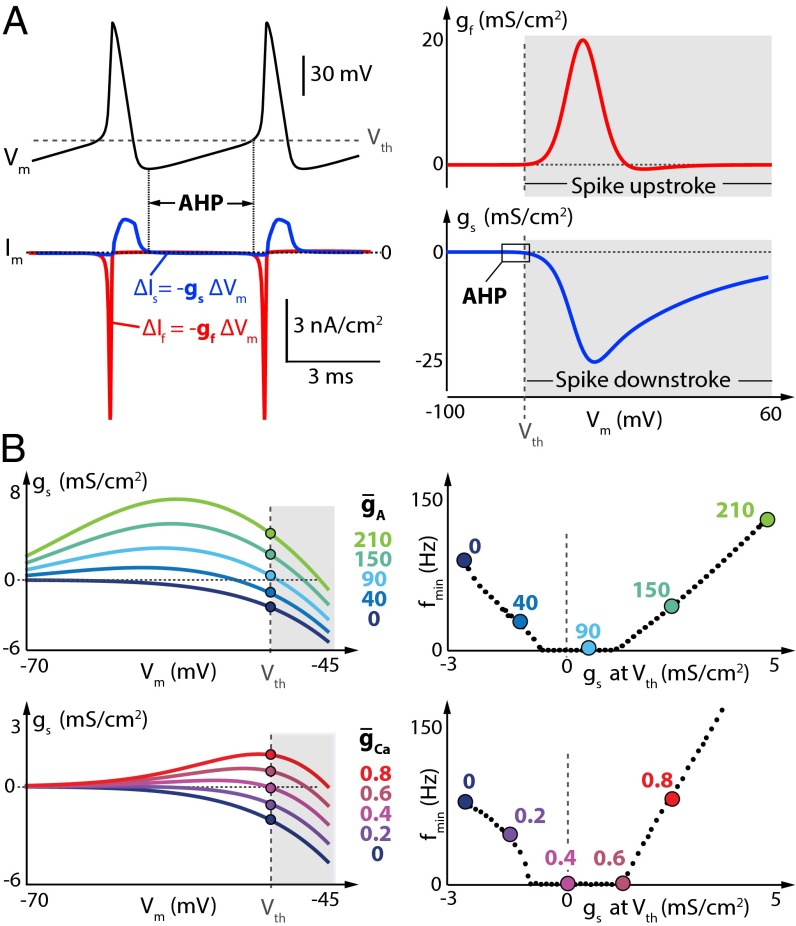
Fig. 3.
Neuron minimal firing frequency (f0) is shaped by the value of the slow DIC at spike threshold. (A) (Left) Membrane potential variations (Top) and corresponding transmembrane current variations (Bottom) over time in the Connor–Stevens model for = 0 and = 0. The red trace corresponds to the fast-varying current, and the blue trace corresponds to the slowly varying current. (Right) Fast (red trace) and slow (blue trace) DIC of the same model in the same configuration. (B) (Left) Zoom of the slow DIC (gs) in the perithreshold region for different values of (Top) or different values of (Bottom). The dots depict the value of gs at spike threshold in the different cases. (Right) Minimum firing frequency as a function of gs(Vth) for increased (Top) or increased (Bottom). Colored points correspond to example traces in B, Left.

