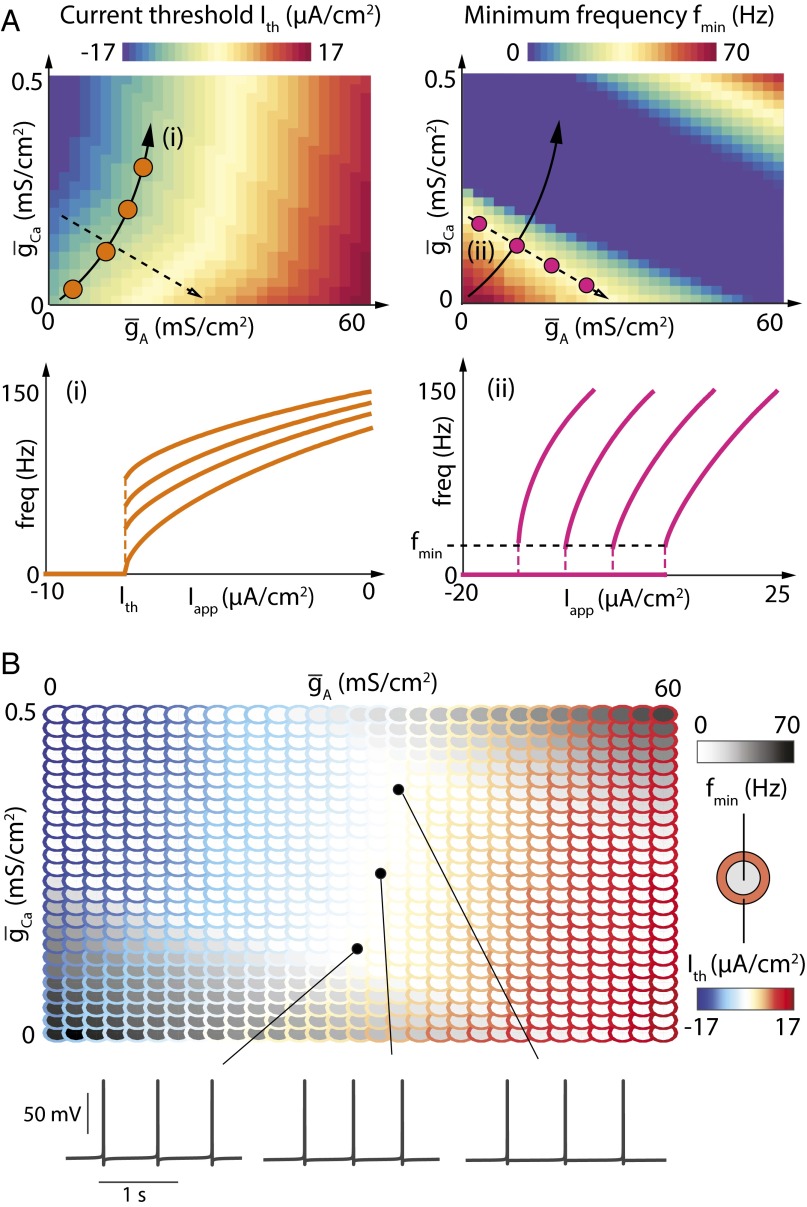
Fig. 5.
A-type potassium channels and calcium channels correlate to independently tune current threshold and minimum firing rate in the Connor–Stevens model. (A) (Top) Values of current threshold (Left) and minimum firing frequency (Right) in the Connor–Stevens model for different values of and . (Bottom) FI curves of the Connor–Stevens model for different couples of values for and , each depicted by dots of the corresponding color in the parameter charts. (B) Parameterscape of current threshold (outer rings, color scale) and minimum firing rate (inner circles, grayscale) as a function of and (Top) and membrane potential variations over time for three sets of parameters (Bottom).

