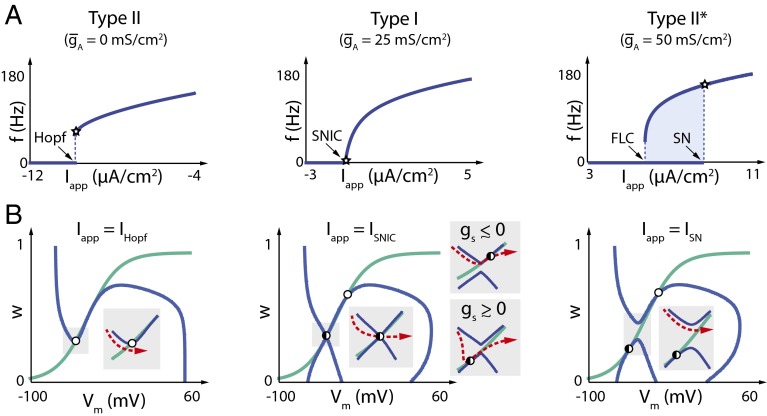
Fig. 7.
Phase plane analysis of Type II–Type I–Type II* transitions in a 2D reduction of the Connor–Stevens model. (A) FI curves in a 2D reduced Connor–Stevens model (see Methods) for three different values of corresponding to (Left) Type II, (Middle) Type I, and (Right) Type II*. Bifurcation types are indicated at the respective values of the applied current (Hopf, Andronov–Hopf; SN, Saddle Node; FLC, Fold Limit Cycle). Stars indicate the value of the applied current at which each phase plane is plotted. (B) Phase planes computed at spiking threshold for each of the three cases. The specific bifurcation induced by applied current, Iapp, is indicated on each plot (IHopf, Andronov–Hopf bifurcation; ISNIC, Saddle Node on Invariant Circle; ISN, Saddle Node). Open circles correspond to unstable fixed points, black filled circles correspond to stable fixed points, and half-filled circles correspond to saddle node points. V nullclines are shown in blue, and w nullclines are shown in green. (Insets) Phase plane detail during repetitive spiking; red dotted arrows indicate membrane potential trajectories.

