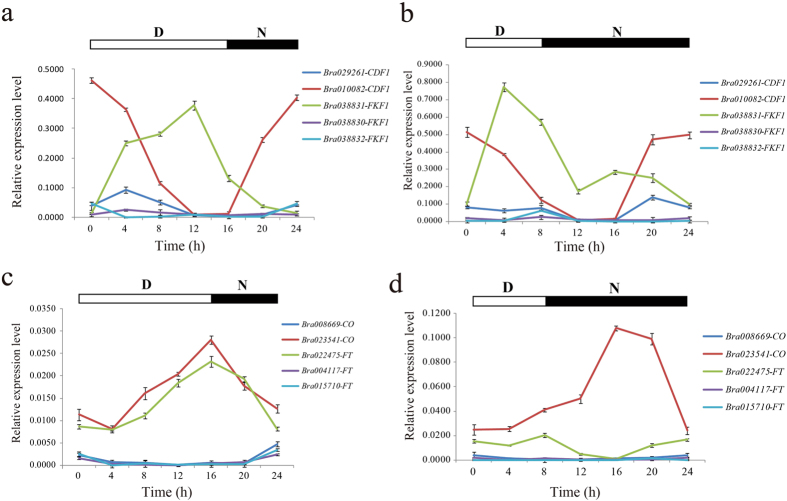
Figure 7. The analysis of the expression of photoperiod pathway and circadian clock-related genes by RT-qPCR.
The bars correspond to the means ± S.D. from three independent experiments. D and N represent day and night, respectively. The RNA expression level relative to the actin gene was calculated using the 2−ΔΔCT method and was thenlog2-transformed. (a) The relative expression of CDF1 and FKF1 genes in Chinese cabbage under LD conditions over a one-day period. (b) The relative expression of CDF1 and FKF1 genes in Chinese cabbage under SD conditions over a one-day period. (c) The relative expression of CO and FT genes in Chinese cabbage under LD conditions over a one-day period. (d) The relative expression of CO and FT genes in Chinese cabbage under SD conditions over a one-day period.

