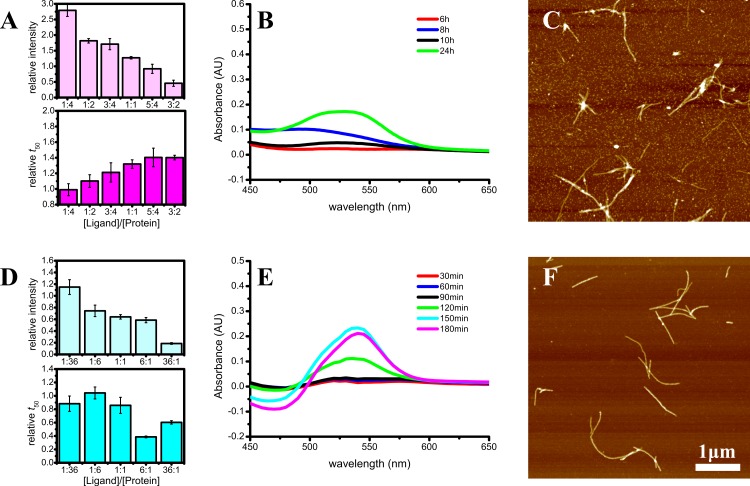
Figure 9. Aggregation of alpha-synuclein (A–C) and Abeta (D–F) in presence of EGCG.
Illustrated by relative ThT intensity and t50 (A and D), Congo Red differential spectra (B and E) and AFM images of final aggregates (C and F). Abeta concentration used for Congo Red and AFM studies was 15 µM. The EGCG/Abeta ratio was 7:1, and EGCG/alpha-synuclein ratio was 3:2.

