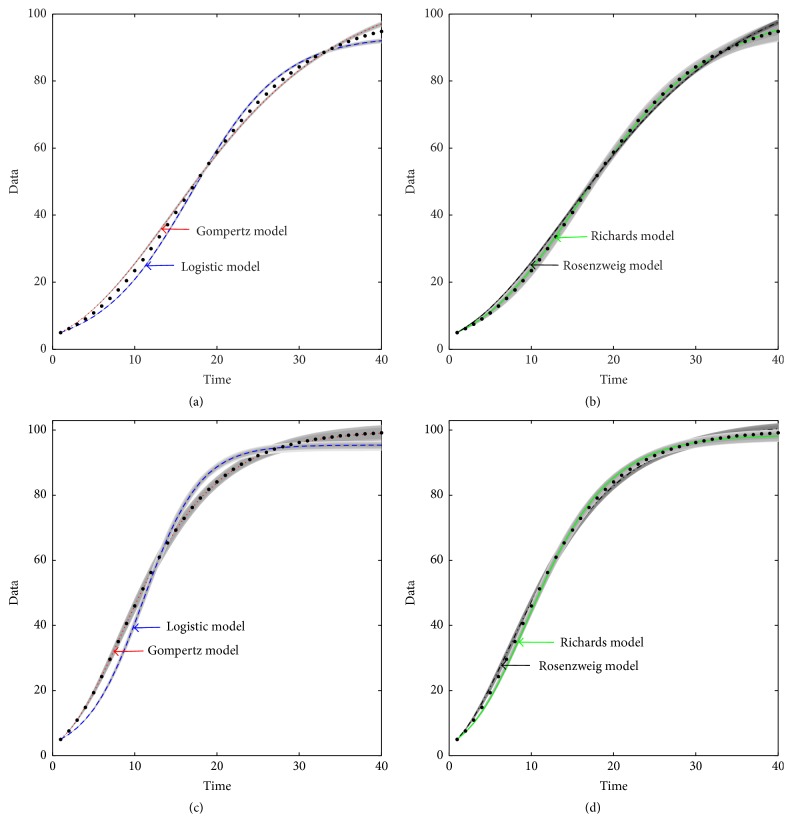
Figure 1.
Model fitting of simulated data generated from Richards model and Gompertz model using four candidate models. The data in (a) and (b) are produced from Richards model; the data in (c) and (d) are produced from Gompertz model. The simulated data points are shown as black dot points. The curves represent the fitting to the data points for four models, respectively. The grey areas are the 95% confidence intervals of each lines.

