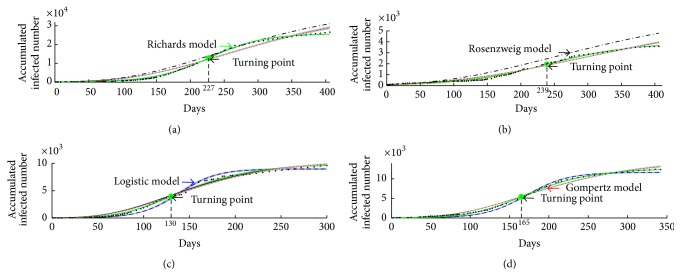
Figure 4.
Model fitting of 2014-2015 Ebola outbreaks in (a) West Africa, (b) Guinea, (c) Liberia, and (d) Sierra Leone. Data of the cumulative numbers of infected cases are shown as black dots. The curves represent the fitting to the data for four models, respectively. The grey areas are the 95% confidence interval of each curves. Cyan curve represents Logistic model; blue curve represents Gompertz model; red curve represents Rosenzweig model; black curve represents Richards model.

