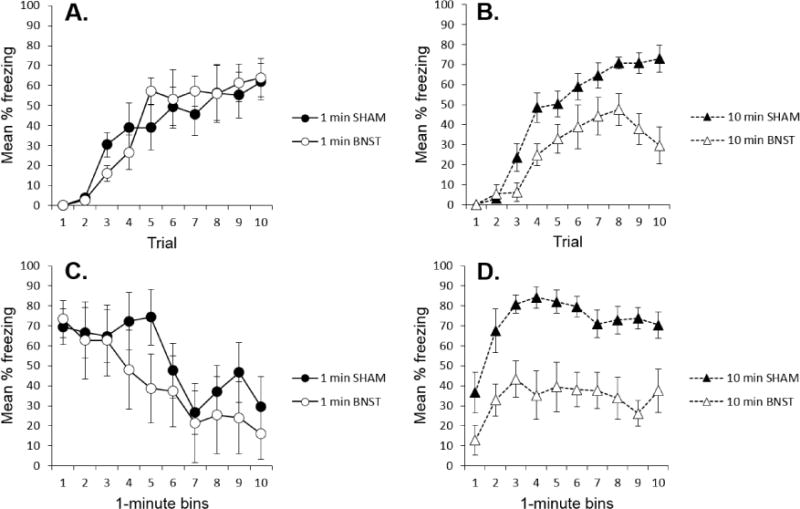
Figure 2.

Behavioral results of the experiment. A. Mean percentage freezing (+ SEM) on each conditioning trial for the sham and BNST-lesioned groups given 1-min context exposures. B. Mean percentage freezing (+ SEM) on each conditioning trial for the sham and BNST-lesioned groups given 10-min context exposures. C. Mean percentage freezing (+ SEM) over time during the 10-min test of the groups previously conditioned with 1-min context exposures. D. Mean percentage freezing (+ SEM) of the groups conditioned with 10-min context exposures over each min of the last two conditioning trials (averaged).
