Figure 1.
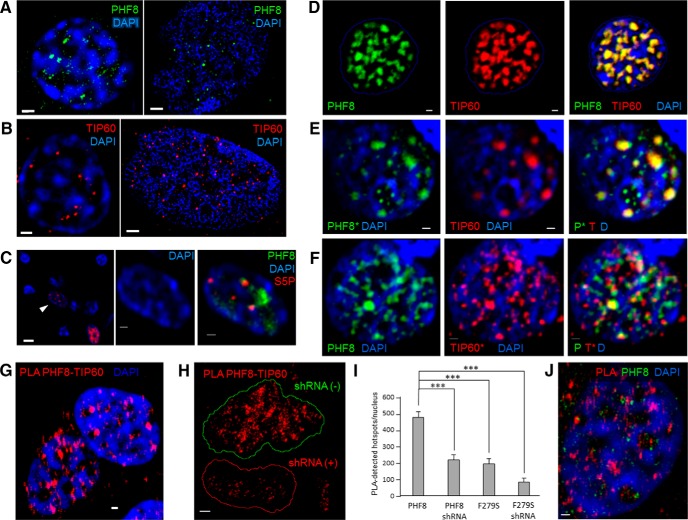
PHF8 and TIP60 colocalize and recruit each other in neuronal interchromatin space. A, Endogenous PHF8 immunostained with anti-PHF8 antibody (ab36068; Abcam) forms hundreds of discrete puncta that specifically localize to the interchromatin space in hippocampal neurons (representative z-slice of a hippocampal neuronal nucleus; left, widefield; right, SIM). Scale bar, 1 μm. B, Endogenous TIP60 forms puncta of roughly the same caliber as those of PHF8 above (left, hippocampal nucleus in widefield; right, SIM), which also localize to the interchromatin space. Scale bar, 1 μm. C, A representative field of hippocampal neurons stained with an antibody against the phosphorylated CTD of RNA polymerase II (YSPTSPS phospho S5, abbreviated to S5P), showing that S5P, a marker of the transcription initiation complex, localizes to the same nuclear compartment as PHF8 in the nucleus. Scale bar, 1 μm. D, A hippocampal neuronal nucleus outlined in blue, showing the localization of spectrally distinct PHF8−tdTomato and TIP60−CFP pseudo-colored in green and red, respectively, which overlapped completely in the nuclear interchromatin space (merge channel, yellow pixels indicate colocalization). DAPI was used to stain the DNA (blue). Scale bar, 0.2 μm. E, When TIP60 is overexpressed by itself in hippocampal neurons (middle, red), endogenous PHF8 (left, green) is seen to be recruited to the TIP60 puncta in hippocampal neurons (right, merge). DAPI was used to stain the DNA (blue). Scale bar, 0.2 μm. Asterisk (*) indicates endogenous protein staining. F, When PHF8 is overexpressed by itself (left, green) in hippocampal neurons, endogenous TIP60 (middle) is seen to be recruited to the PHF8 puncta (right, merge). DAPI was used to stain the DNA (blue). Scale bar, 0.2 μm. Asterisk (*) indicates endogenous protein staining. G. Endogenous TIP60 is located within 30 nm of PHF8 as shown by P-LISA, showing distinct areas where PHF8 interacts with endogenous TIP60 (red spots) on the border with DAPI-dense regions (blue). Scale bar, 0.5 μm. H, Two Hek293 nuclei are shown, one is positive for PHF8 shRNA (outlined in red) while the other is not (outlined in green). Positive PHF8−TIP60 interaction hotspots were stained as red punctae. Scale bar, 0.5 μm. I, Quantification of the number of hotspots found in cells transfected with PHF8, PHF8 shRNA, the mutant PHF8 F279S, or, in F279S-transfected cells expressing PHF8, shRNA were quantified using Blobfinder, and the means and standard errors are displayed in a bar grapht (triple asterisks indicating statistical significance using the unpaired t test; p ≤ 0.0001). J, Double immunofluorescence confirming the existence of PHF8 in the identified PLA hotspots where PHF8 and TIP60 interact. Scale bar, 0.5 μm.

