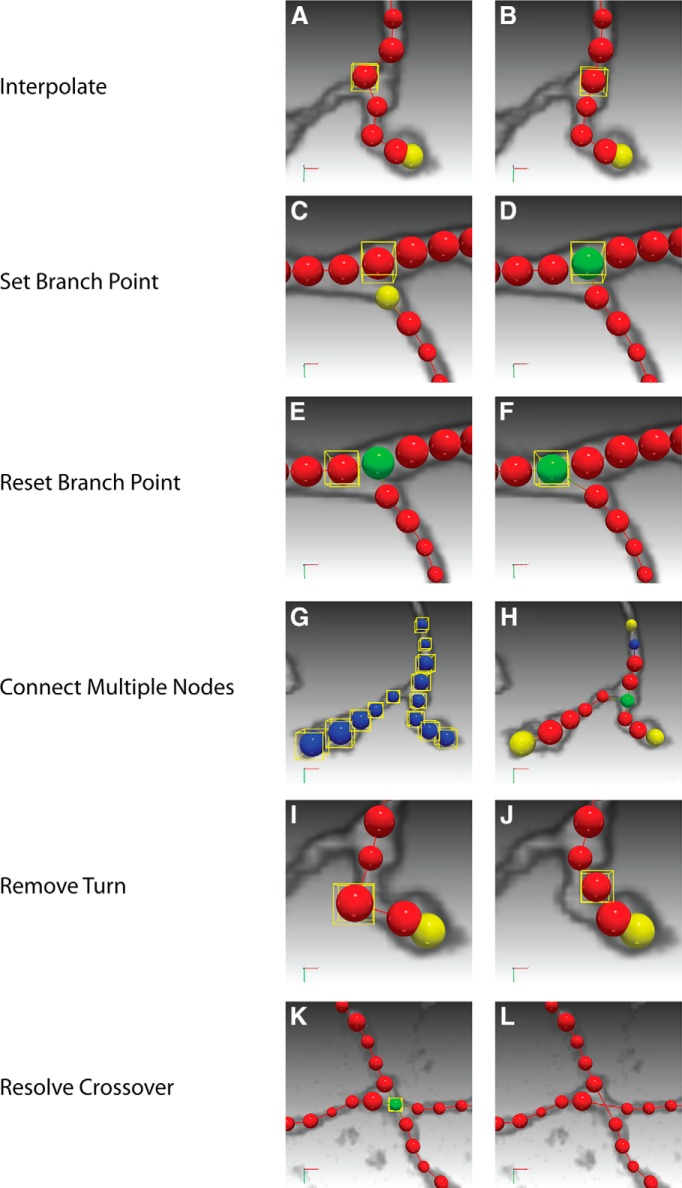
Figure 4.
Examples of high-level operations of neuTube 1.0. To illustrate the operation, we visualize the nodes of a neuron in different colors according to the topology: blue for root nodes, green for branch nodes, yellow for leaf nodes, and red for other nodes. Selected nodes are highlighted by a yellow bounding box. For the corresponding operation as named in each row, the panels on the left (A, C, E, G, I, K) show the selected nodes to operate and the panels on the right (B, D, F, H, J, L) show the result of operation.

