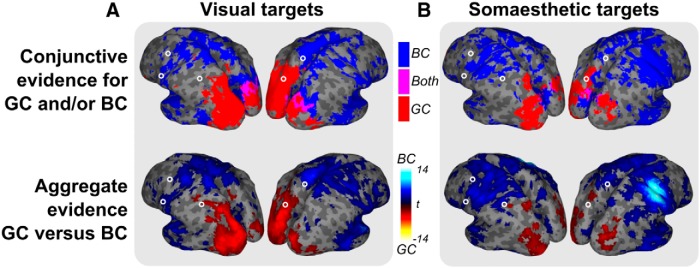
Figure 4.

Evidence maps for reference frames (GC and BC) per modality (A, visual targets; B, somaesthetic targets) obtained either by the conjunction of classification and cross-classification evidence for each reference frame (top row) or by contrasting the aggregate evidence between reference frames (bottom row). The top row shows binary maps for body-centered (blue), gaze-centered (red), and both reference frames (magenta). The bottom row shows t values for the difference in aggregate values between gaze-centered and body-centered evidence (cold colors, BC; warm colors, GC). Note the consistent division between posterior GC and anterior BC evidence in both modalities, across panels. Only relevant clusters are included (p < 0.05, uncorrected; cluster-size, >250); open circles indicate ROI locations.
