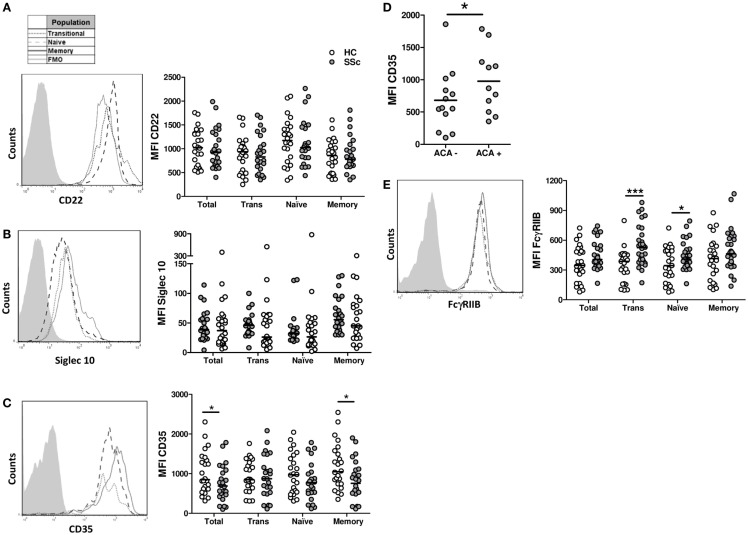
Figure 5.
Expression of the inhibition receptors CD22 (A), Siglec 10 (B), CD35 (C,D), and FcγRIIB (E) in B cells from systemic sclerosis patients (n = 24, 24, 24, and 30, respectively) and healthy subjects (n = 24, 24, 24, and 25, respectively). (A–C,E) Left: representative histograms of the expression of each molecule on transitional (dotted line), naive (dashed line), or memory B cells (solid line). The shaded curve represents the fluorescence minus one (FMO) control staining. Right: graphs summarizing the expression of each molecule on total CD19+ B cells, transitional B cells (Trans), naive B cells, and memory B cells in healthy controls (HC, white circles) and systemic sclerosis patients (SSc, gray circles). (D) Expression of CD35 in SSc patients according to the presence of anticentromere antibodies (ACA). *P < 0.05, ***P < 0.001. Paired Student’s t-test for graphs in (A,C), Wilcoxon signed-rank test for graphs in (B), and unpaired Student’s t-test for graphs in (D,E). MFI, mean fluorescence intensity.

