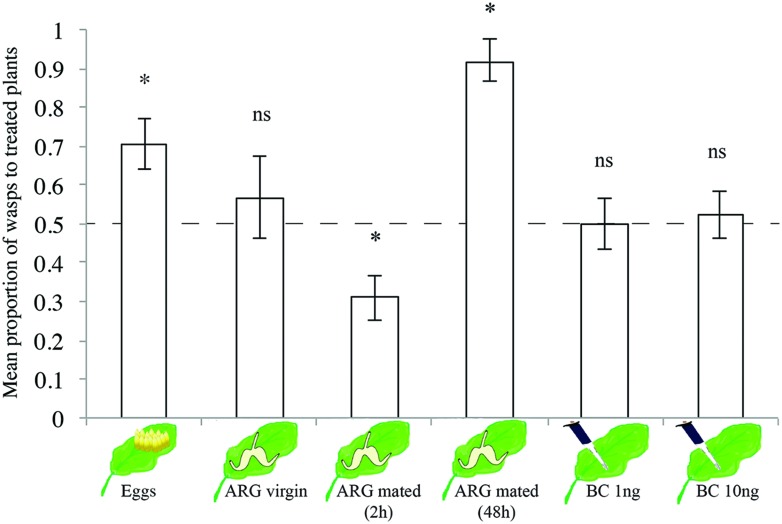
FIGURE 4.
Proportion (mean ± SE) of female Trichogramma evanescens wasps choosing volatiles of differently treated B. nigra plants when tested against untreated or solvent-treated control plants in a Y-tube olfactometer. Each treatment, (1) P. brassicae eggs 24 h after egg deposition, (2) ARG (of virgin P. brassicae females, (3) ARG of mated P. brassicae females 2 h after mating, (4) ARG of mated P. brassicae females 48 h after mating, (5–6) BC in two concentrations (1 and 10 ng/100 μl ethanol) was replicated with four to seven plant pairs and 20 wasps per plant pair (n = 80–140 wasps per treatment). ∗p < 0.05, ns, not significant (p > 0.05); one-sample t-test. The dashed line indicates 0.5 = no preference. For statistical analysis, data were first arcsine transformed and then back-transformed for presentation.

