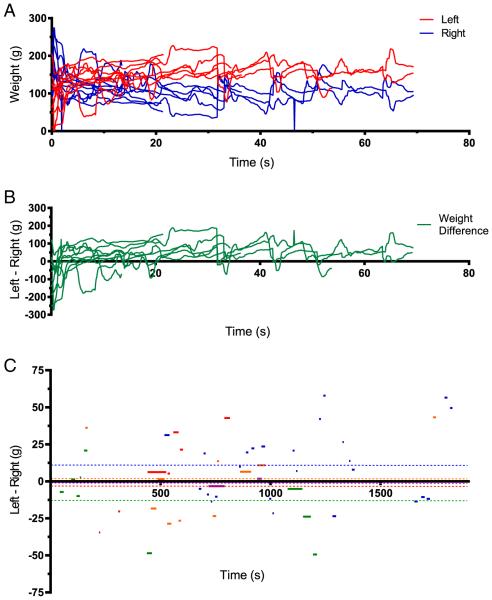
Fig. 3.
Time course of weight distribution during access epochs. A. The raw weight measures for left (red) and right (blue) are plotted as a function of time where each access epoch is overlapped and plotted from time 0. The access duration varied from some lasting as long as 70 s to some lasting only a few seconds. A change of weight distribution on the left limb is often reflected by a reciprocal change in the right limb. Data is from one rat. B. Weight difference plotted as Left–Right for the data shown in A. C. The mean weight difference (Left–Right) shown for every access during a 30 m observation session. The data was post hoc processed to remove the initial and terminal 2 s of data with a larger variability from every access epoch, and only data within 1 S.D. are plotted. The different colors represent different rats. The dashed colored lines extending for the entire duration are the final mean weight-bearing difference for the individual rats. The overall weight-bearing difference (n = 5, mean = 5.8 ± 14.2 g) for this cohort of control rats was statistically not significantly different from 0 (P > 0.5). (For interpretation of the references to color in this figure legend, the reader is referred to the web version of this article.)

