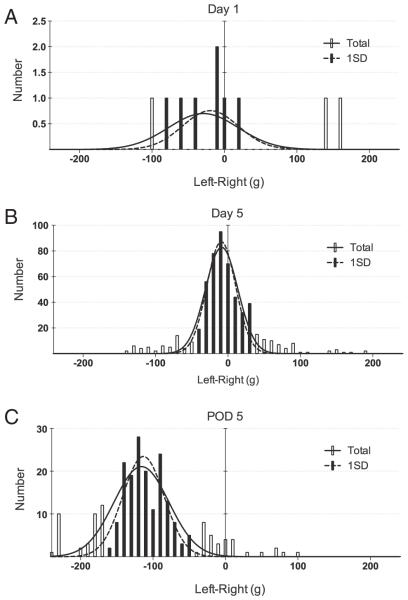
Fig. 4.
The weight-bearing data is normally distributed. A. L–R weight distribution data for a naïve rat. B. A significant number of weight data points are generated in the same animal after 5 days of 3 h pre-VASIC water restriction conditioning. All weight data shown are from a single 30 m observation session (n = 556, mean = − 8.70 ± 0.05 g). C. The same rat at post-operative day (POD) 5 after CCI (n = 232, mean = − 116.0 ± 2.49 g). Note the difference in the vertical axis. Pre- and post-CCI means were significantly different (P < 0.001). The open bars are outliers defined as data points beyond 1 S.D. Fitting of a normal distribution to all data points (dashed line) or after exclusion of the outliers (solid line) had no effect on the estimation of the mean. All data is from a single rat conditioned by water restriction for 3 h before each VASIC session.

