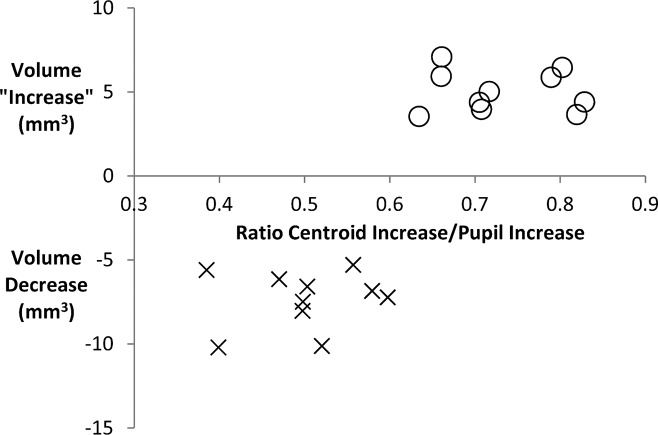
Figure 3.
Graph shows the ratio of the increase in the distance between nasal and temporal iris centroids (centers of mass) to the increase in pupil diameter as eyes go from light to dark (x-axis) versus calculated change in iris volume using a published method (y-axis). Twenty eyes were selected; all eyes had iris area loss, 10 with iris volume loss (X), and 10 with iris volume increase (O). It is clear that the anomalous eyes (those with volume increase) had higher ratios of centroid-to-pupil increase, indicating that the shift in iris area toward the anterior chamber angle was disproportionately greater in these eyes, placing more iris tissue in apposition to the angle and increasing the chance of AC.

