Fig. 1.

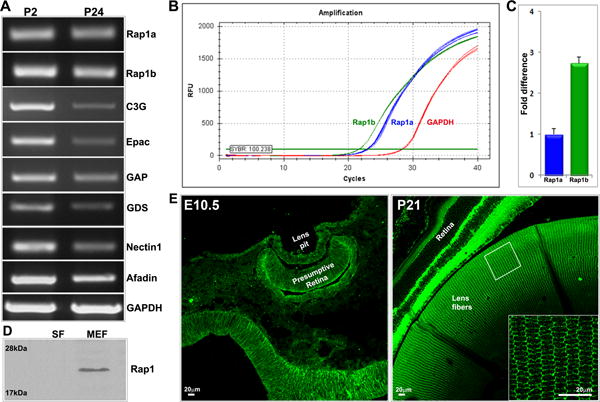
Expression and distribution profile of Rap1 GTPase and its effectors in mouse lens. A. RT-PCR analysis-based assessment of expression of Rap1a and Rap1b and their different effector and interacting proteins in P2 and P24 mouse lenses, using GAPDH expression for cDNA normalization. B & C show the qRT-PCR amplification traces for Rap1a and Rap1b expression relative to GAPDH, and the relative fold difference in expression in P2 mouse lenses, respectively. D. Distribution of Rap1 (Rap1a/Rap1b) protein in the soluble fraction (SF) and membrane enriched fraction (MEF) of P24 mouse lens based on immunoblotting analysis. E. Distribution of Rap1 in the developing (embryonic day10.5) and P21 mouse lens based on immunofluorescence analysis. The smaller rectangular box in the right panel is a magnification of the area shown as an inset. In the mature lens fibers (insert) Rap1 is localized predominantly at the cell membrane. In panel C, the error bar indicates SEM based on values derived from three independent analyses. In panel E bars represent image magnification.
