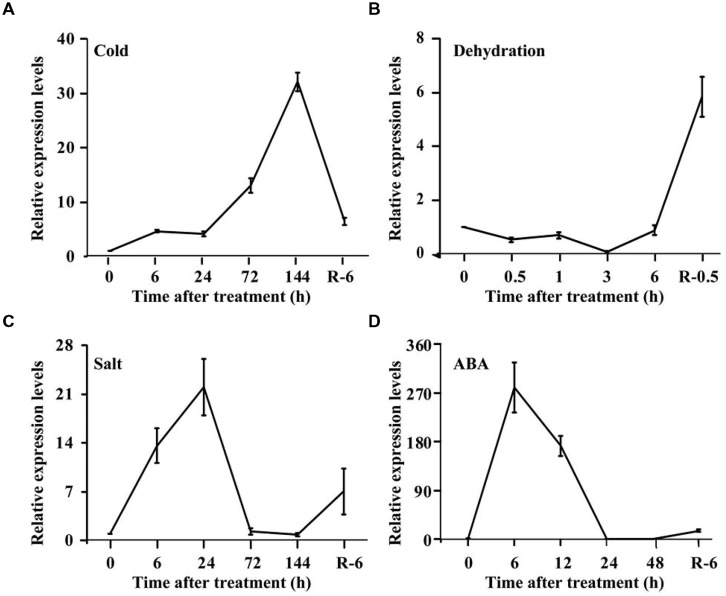
FIGURE 5.
Expression analysis of PtrPRP in response to various treatment, including cold (A), dehydration (B), salt (C), and ABA (D). Expression levels of PtrPRP at the onset of treatment (0 h) were set as 1, and those at other time points were calculated accordingly. R indicates recovery after the corresponding treatments.

