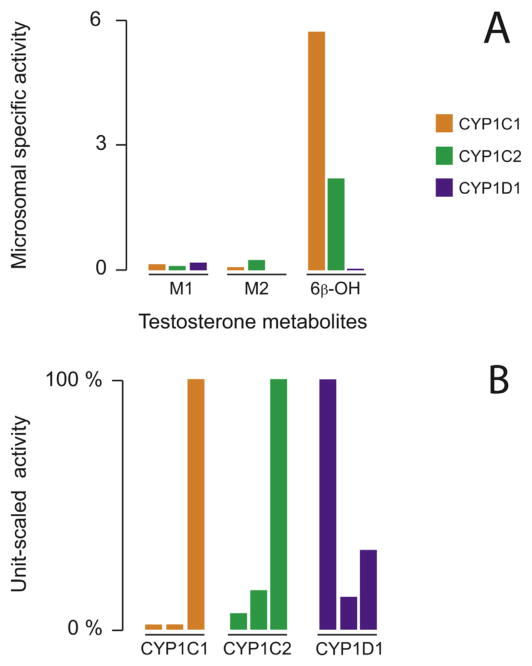
Fig. 6.
Testosterone metabolite profiles for CYP1Cs and CYP1D1. Panel A, microsomal specific activity calculated for each testosterone metabolite from its peak area (arbitrary units) expressed per min and per mg of yeast microsomal protein. The retention times of the different compounds were M1 (5.3 min), M2 (6.6 min), 6β-hydroxy (7.1 min), and testosterone (8.1 min) for a total run time of 14 min. Panel B, testosterone metabolite profiles obtained for each CYP enzyme from unit-scaling the specific activities to the highest one. For each CYP enzyme, bars represent from left to right, hydroxylated testosterone M1 (unknown), hydroxylated testosterone M2 (unknown), 6β-hydroxy-testosterone.

