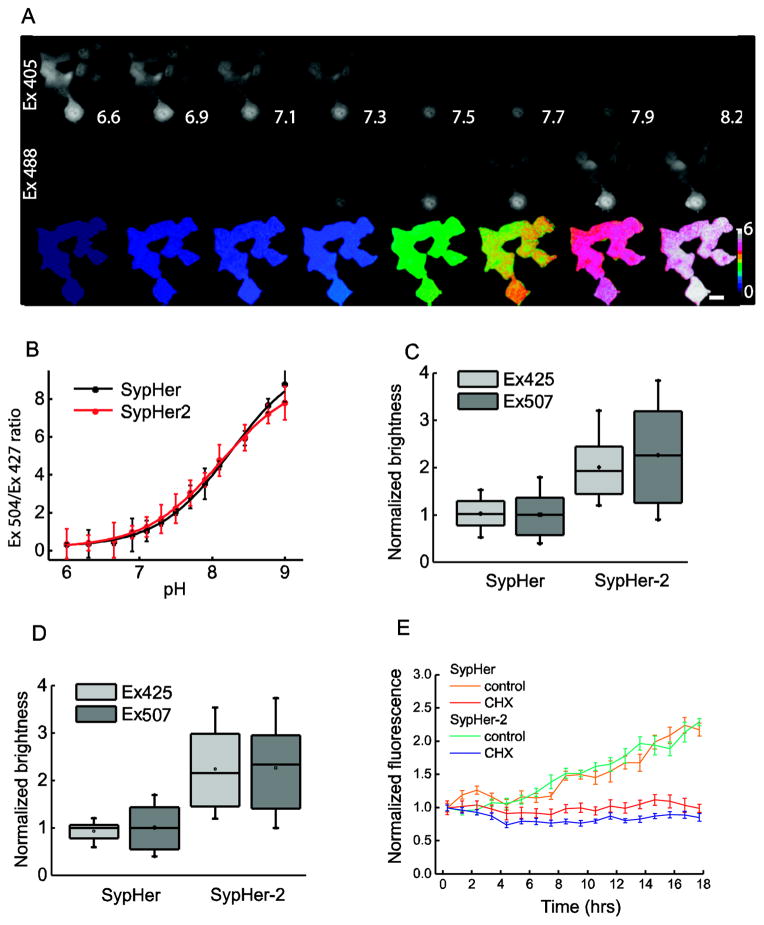
Fig. 1. SypHer-2 vs. SypHer pH sensitivity and brightness in cells.
A) Calibration of SypHer-2 in HeLa-Kyoto cells with ionophore-containing buffers. The signal was measured as a ratio between intensities of fluorescence excited by 504 nm (middle row) and 427 nm (upper row) light. Numbers represent calibration buffer pH, scale bar 25 is μm. Lookup table reflects SypHer-2 ratio. B) Calibration curves for SypHer (black) and SypHer-2 (red). At each pH point mean fluorescence excitation ratio was measured for at least 20 HeLa cells. C), D) Brightness of SypHer-2 vs. SypHer fluorescence excited by 427 nm (light grey) and 504 nm (dark grey) light in NIH/3T3 (C) and HeLa-Kyoto (D) cells. Fluorescence intensities were collected for at least 15 cells for each line and normalized using mean SypHer fluorescence at 504 nm excitation. Error bars indicate 2xSEM. 18 h after transfection with SypHer or SypHer-2 plasmids, cells were incubated with 60 μM protein synthesis inhibitor cycloheximide (CHX) for 1 h and mean fluorescence from 20–30 cells, excited at 504 nm, was collected every hour. Error bars indicate 2xSEM.

