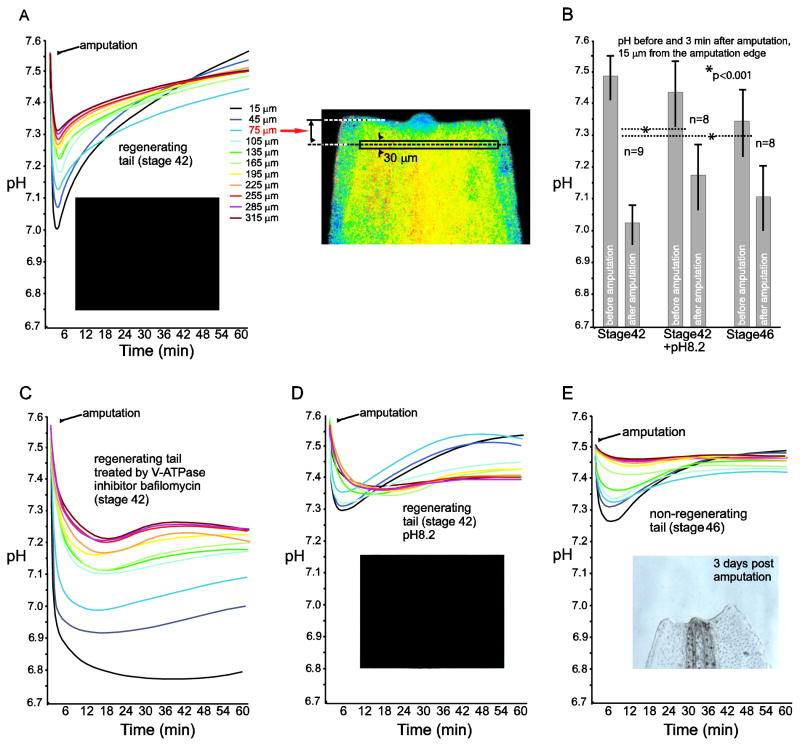
Fig. 4. Intracellular pH drop in the tail of Xenopus laevis tadpole after amputation.
A) Typical dynamics of mean pH value changes as measured in ten transverse rectangular frames before amputation and during one hour after it (see Materials and Methods for details). Each of dynamics curve is marked by a specific color, beginning from the black color, which is assigned to the frame nearest to the amputation edge. The position of each frame from the amputation edge to the median of the frame is indicated in microns. Inset image shows the tip of the same regenerating tail after 3 days of amputation. An example of the amputated tail in pseudocolors corresponding to SypHer-2 ratio, with one measuring frame located at position of 75 μm from the amputation edge is shown on the right. Note that the blue color on the sides of the tail is a specific characteristic of this particular tail in which the injected SypHer-2 mRNA is absent in cells of the lateral sides of the tail. Due to a low auto-fluorescence of the tail tissues the ratio of fluorescence intensities in the lateral regions appears to be different from zero and appears as a constant blue pseudocolor. Of note, the auto-fluorescence intensity is more than 10-fold lower than the intensity of signal generated even by low amount of SypHer-2; B) Mean value of pH near the amputation edge (measuring frame with the median at 15 μm from the edge) before amputation and in the minimum of pH dynamics curve of stage 42 tails (left pair of bars), stage 42 tails of tadpoles treated by pH 8.2 solution for 2 h before amputation (middle pair of bars) and stage 46 tails (right pair of bars). Standard deviation is indicated for each bar. The numbers show total number of tails in which pH was measured at the level of 15 microns from the amputation edge before and after amputation.; C) Representative dynamics of mean pH value measured as described in A, but in tails of stage 42 tadpoles treated with a V-ATPase inhibitor bafilomycin (200 nM for 1 h before amputation); D) Representative dynamics of mean pH value measured as described in A, but in tails of stage 42 tadpoles treated by pH 8.2 solution for 2 h before amputation. Inset image shows tip of the same tail after 3 days of amputation; E) Representative dynamics of mean pH value measured as described in A, but in tails of stage 46 tadpoles. Inset image shows tip of the same tail after 3 days of amputation.

