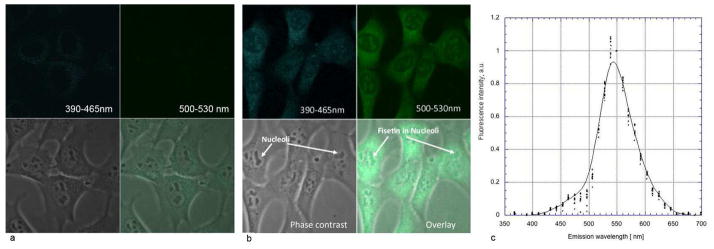
Figure 3. Spectral signature of fisetin in HT22 nerve cells.

Cells were treated with 10 μM fisetin for 30 min and then examined by two-photon microscopy using excitation at 780 nm (b). Control cells were treated with DMSO and imaged 30 min after treatment (a). The emission spectra were measured for 10 individual cells and normalized to unity at 550 nm (c). In other words, the signal intensity measured at 550 nm was assigned a value of 1 and all other points were scaled according to this ratio. Imaging panels: blue fluorescence channel (390–466 nm), top left; green fluorescence channel (500–530 nm), top right; conventional phase contrast image, bottom left and an overlay of all three, bottom right panel. Field of view (FOV) was 90 μm × 90 μm.
