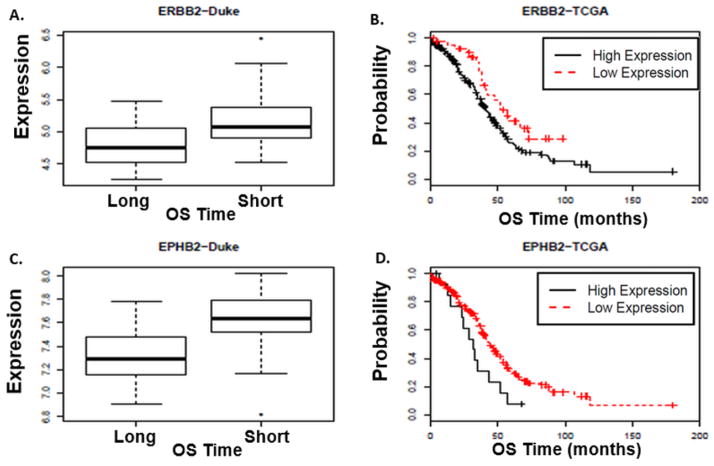
Figure 2. Association between ERBB2 and EPHB2 gene expression levels and overall survival (OS) in HGSC.
The Duke data revealed that HGSC patients whose tumors expressed high ERBB2 and EPHB2 gene expression were more likely to have a short survival (OS ≤ 3 years) compared to those women with low ERBB2 and EPHB2 expression (ERBB2 q-value= 0.02; EPHB2 q-value= 0.01) (A and C, respectfully). In the TCGA database, higher ERBB2 and EPHB2 expression levels were also associated with shorter OS. (B) The median OS for HGSC patients with high ERBB2 expression was 32 months compared to 44.5 months in patients with lower ERBB2 expression (ERBB2 p-value= 0.05, HR= 1.2). (D) The median OS for HGSC patients with high EPHB2 expression was 41.4 months compared to 52 months in patients with lower EPHB2 expression (EPHB2 p-value= 0.05, HR= 1.2). Conditional inference trees were used to find optimal cutpoints. Based on cutpoints, the TCGA and Duke “low expression” columns represents the number of patients in the “low expression group” and “high expression” columns represents the number of patients in the “high expression group”. The Duke results are shown in box plots. The distribution of the gene expression, y-axis, was estimated conditional on surviving less than three years and compared to that of the conditional distribution of surviving at least seven years. In a boxplot, the box spans the interquartile range (IQR) of the data set and the line within the box denotes the median. Potential outliers (extreme values) are represented as separate points beyond the data set “whiskers”. The whiskers illustrate the spread of the data.

