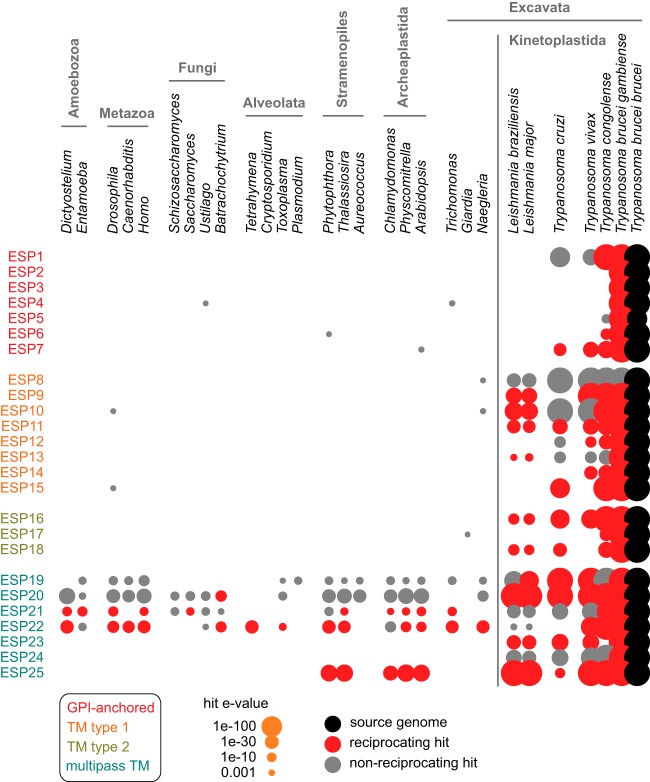
Fig. 5.
The distribution of ESPs across eukaryotes. Conservation was investigated by analysis of BLAST hits in the predicted proteomes of model species from a wide range of eukaryotic lineages. Spot size represents the strength of BLAST hit (e-value). Red shows reciprocal best-BLAST hits between genomes; gray shows non-reciprocating hits.

