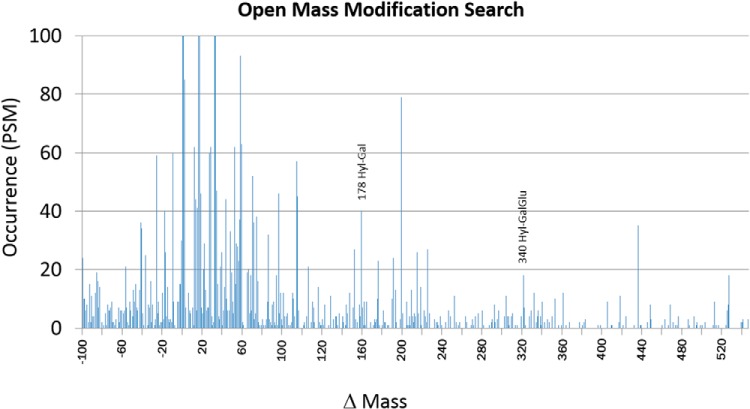
Fig. 3.
Occurrence plot from open mass modification search using Protein Prospector Batch-Tag. The Y-axis is limited to <100 peptide spectra matches to improve visualization of lower abundant mass modifications. Mass additions consistent with galactosylation and glucosylgalactosylation of hydroxylysine are highlighted.

