
Fig. 3.
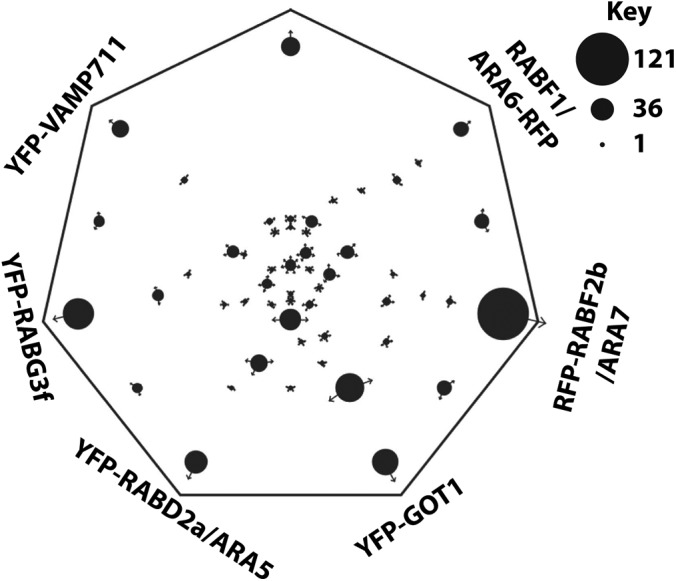
Sungear diagram of proteins assigned to the different proteomes. Sungear diagrams generated in virtual plant (http://virtualplant-prod.bio.nyu.edu/cgi-bin/sungear/index.cgi (51)). Groups of proteins are indicated by the black dots, with a size proportional to the number of proteins in the group. The arrows on each dot indicate the proteome assignment of a group of proteins. Enrichments were performed three times for each bait, proteins were accepted with SAINT scores >0.8.