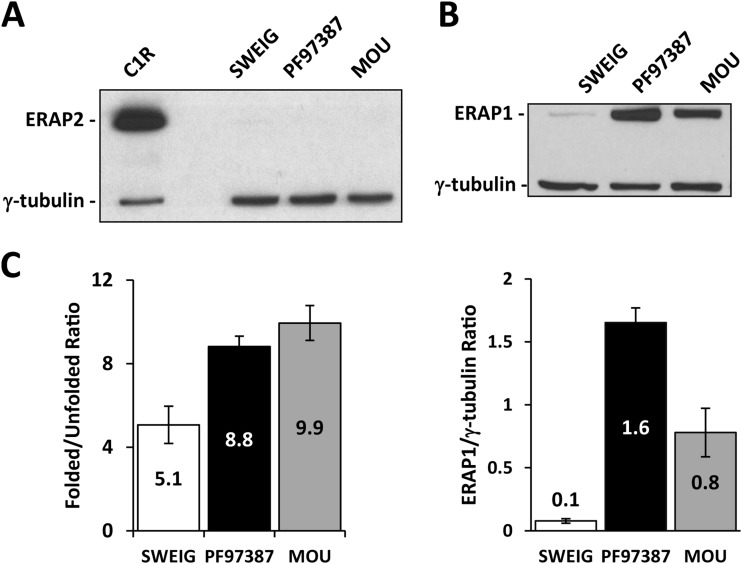
Fig. 2.
ERAP1 and ERAP2 expression among cell lines. ERAP2 (A) and ERAP1 (B) expression was assessed by Western blotting. Gamma-tubulin- was used as internal control. Representative experiments are shown. ERAP1 was normalized as the ERAP1/γ-tubulin ratio to compare the expression levels among cell lines (lower panel). These data are means of three experiments. (C) Surface expression of folded and unfolded A*29:02 was assessed using the 108–2C5 and HCA2 mAbs, respectively, to establish the folded/unfolded HLA-A ratio in each cell line. The data are the mean ± S.D. of at least three experiments.

