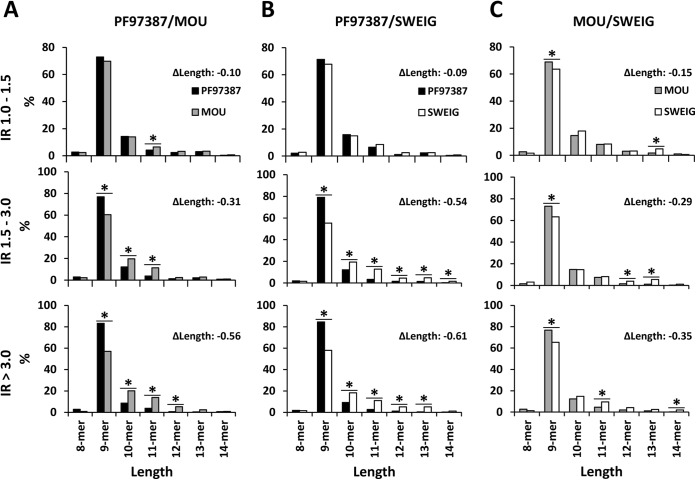
Fig. 4.
Length distribution of A*29:02 ligands as a function of their relative abundance in distinct ERAP1 contexts. (A) A total of 4,583 shared peptides were identified in the PF97387/MOU comparison. They were classified in the indicated subsets on the basis of the intensity ratio (IR) of the corresponding ion peaks. The peptides of a given length in each subset from one cell line were compared with those of the corresponding subset from the other cell line. From top to bottom, peptides showing IR>1.0 to 1.5, IR>1.5 to 3.0 and IR>3.0, respectively, were compared. (B) A total of 3,701 shared peptides identified in PF97387/SWEIG were compared as in panel A. (C) The 3,747 shared peptides identified in MOU/SWEIG were analyzed as in panels A and B. In each panel, the differential mean length between the two peptide subsets compared (ΔLength) is indicated. Statistically significant differences (p < .05) were determined by the χ2 test and labeled with asterisks (*).

