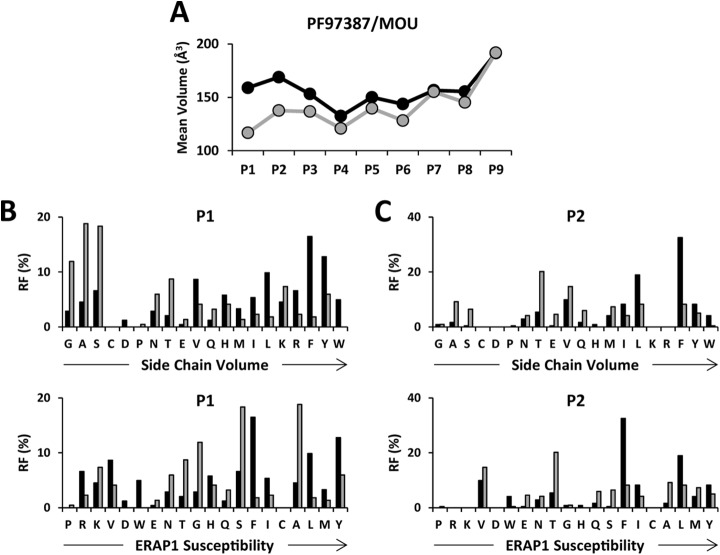
Fig. 6.
Position-dependent effects of ERAP1 on A*29:02 ligands. The IR>3 nonamers from each cell line in PF97387/MOU (black and gray, respectively) were compared. (A) Mean side-chain volumes at the indicated peptide positions were calculated and compared using the residue frequency (RF) and the experimental side-chain volume of each amino acid. (B) RF values at P1 were ordered as a function of the side-chain volume (upper panel) or ERAP1 susceptibility (52) (lower panel). (C) The RF values at P2 were ordered and compared as above.

