
Fig. 1.
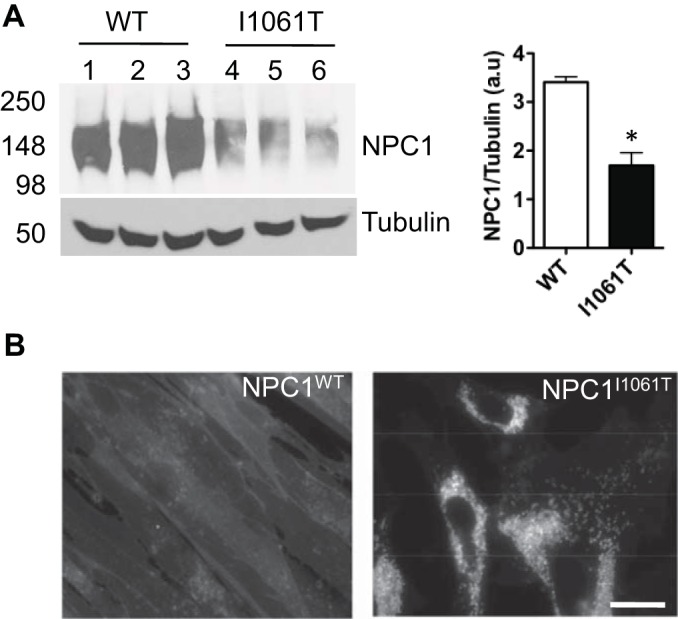
A, Western blot showing the down-regulation of NPC1 protein in NPC1I1061T fibroblasts when compared with NPC1WT. Twenty-five μg of cell lysates were resolved in 8% SDS-PAGE and immunoblotted with rat anti-NPC1 antibody. For equivalent loading control, tubulin was probed with mouse anti-tubulin antibody. Band intensities were quantified using the Image J software. * indicates statistically significant (p < 0.05) difference in NPC1I1061T expression level relative to NPC1WT. B, Filipin staining visualization of massive accumulation of unesterified cholesterol in late endosomal/lysosomal compartments in NPC1I1061T cells relative to wild-type skin fibroblasts. Cells were visualized by fluorescence microscopy using a UV filter set at 340–380 nm excitation. Scale bar is 10 μm.