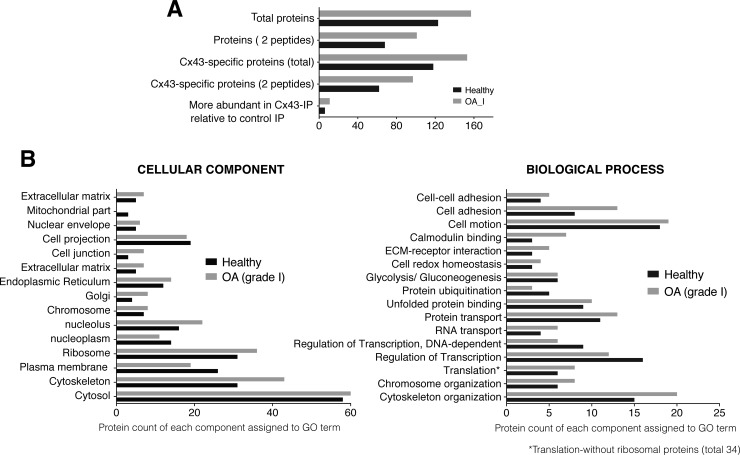
Fig. 4.
Analysis of Cx43-associated proteins identified in the OA samples. Four different samples of chondrocytes from four OA patients were analyzed. A, A summary of the number of the identified proteins. Gray represents the Cx43 interactors identified in samples from OA grade I. Proteins identified as specific to the Cx43-IP but absent from the control IP (no antibody). The number of proteins identified as most likely more abundant in the Cx43-IP than in the control-IP (peptide difference ≥2). See supplemental Table S3 for a complete list of the proteins identified in the Cx43-IP and control IP. B, GO analysis for the identified proteins. Overall, the proteins were identified with 95% peptide confidence (minimum value 1.3 of unused cutoff). See supplemental Tables S1–S3 for a complete list of the identified proteins. Gray represents the Cx43 interactors that were identified in samples from OA grade I patients.

