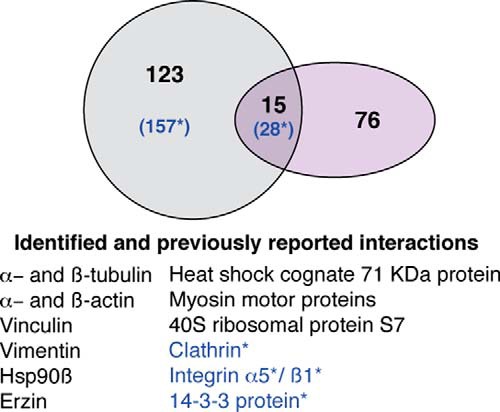
Fig. 5.

Meta-analysis of Cx43 mass-spectrometric data. Proportional Venn diagram comparing the Cx43-asociated proteins that were identified in the present study (dark gray circle) to those from previous reports (purple circle). Overlap (green) includes proteins present in both groups. Blue letters and asterisk (*) represent Cx43 interactors identified in samples from OA grade I. Some of these previous studies used co-IP, colocalization or affinity techniques and nuclear magnetic resonance using different types of cells and tissues from rat, mouse, human, porcine, goldfish, rabbit, or chick. See the reference list of some of the selected reports and reviews for meta-analysis (16, 17, 32, 36–45). None of the previous studies were performed using cartilage or articular chondrocytes.
