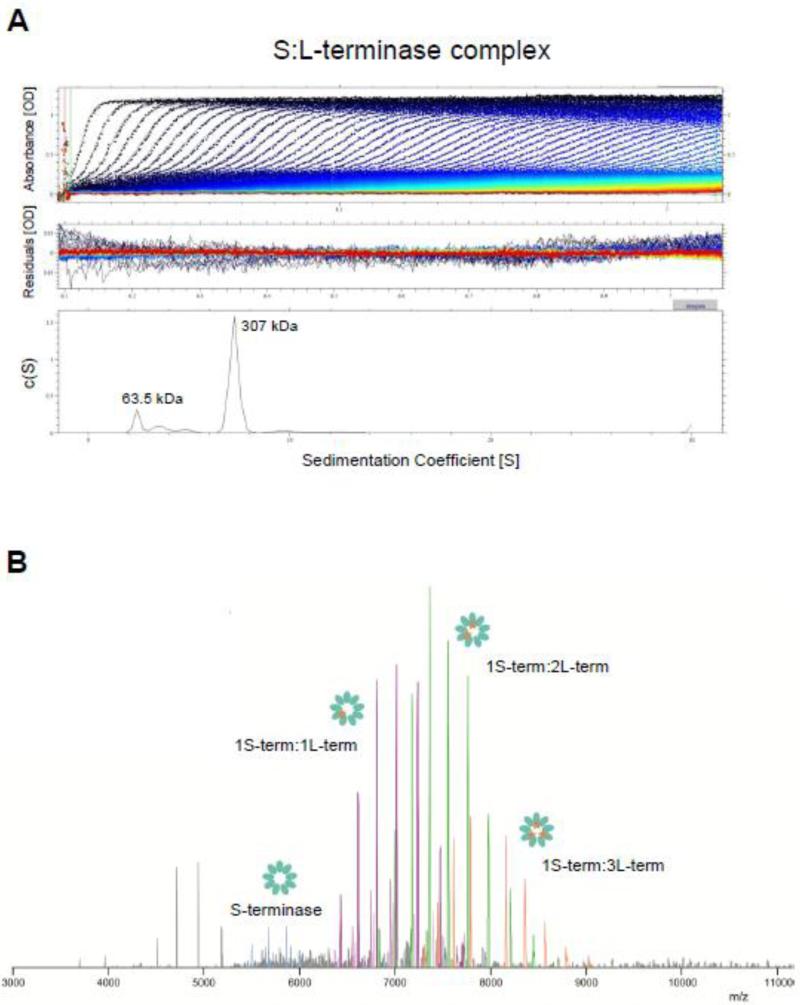
Figure 2. Biophysical analysis of the purified S:L-terminase complex.
(A) Sedimentation velocity profiles of the S:L-terminase complex measured in 20 mM Tris-Cl pH 8.0, 150 mM NaCl, 3 mm DTT, 5% glycerol, 1 mM MgCl2 at 10 °C. Top panel: raw absorbance at 280 nm plotted as a function of the radial position. Data at intervals of 20 min are shown as dots for sedimentation at 35,000 rpm. Middle panel: the residuals between fitted curve and raw data. Bottom panel: the fitted distribution of the apparent sedimentation coefficient (s*) calculated for S:L-terminase is 7.2S (~85% sample) and 2.7S (<15% sample) corresponding to an estimated molecular mass of ~307 kDa and ~63.5 kDa, respectively. (B) Native MS analysis of the S:L-terminase complex. The following masses are observed: 1S-terminase:1L-terminase: 231.465 ± 0.002 kDa (purple peaks); 1S-terminase:2L-terminase: 286.989 ± 0.012 kDa (green peaks); 1S-terminase:3L-terminase: 342.514 ± 0.008 kDa (orange peaks); nonamer of S-terminase: 175.955 ± 0.002 kDa (magenta peaks).

