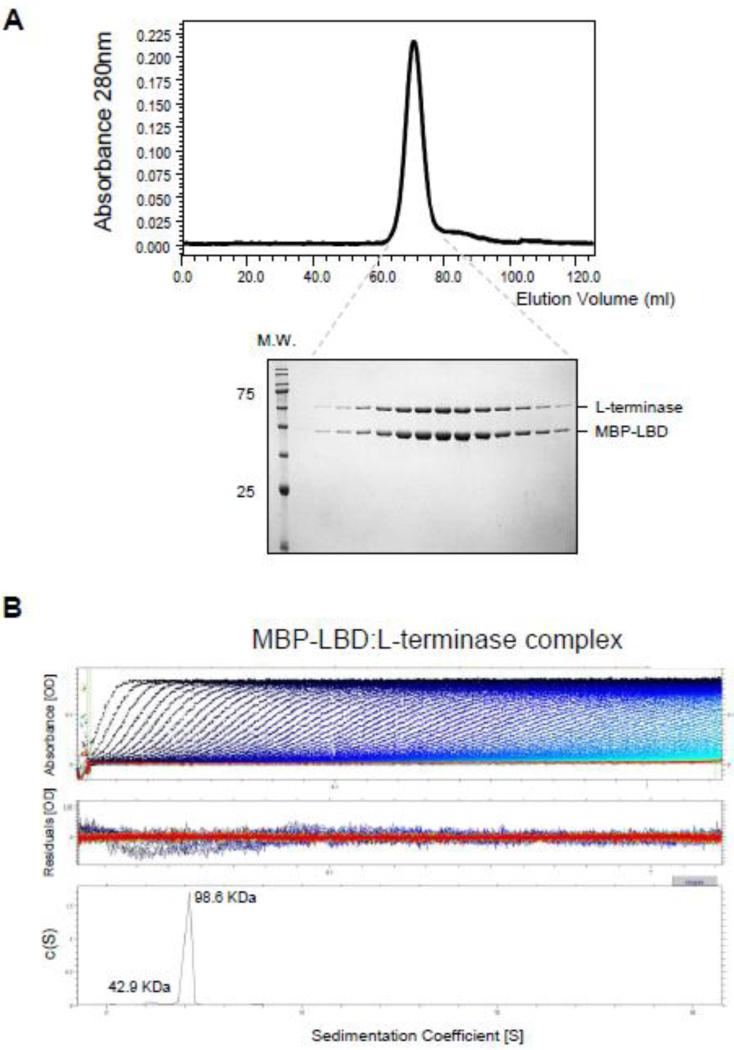
Figure 3. Stoichiometric binding of L-terminase to the LBD.
(A) Chromatogram of the purified MBD-LBD:L-terminase complex eluted with 10 mM maltose from amylose beads and separated on a Superdex 200 gel filtration column. Fractions corresponding to the eluted peak were analyzed by SDS-PAGE (bottom gel) revealing a 1:1 stoichiometry of association between L-terminase and MBP-LBD. (B) Sedimentation velocity profiles of the MBP-LBD:L-terminase complex measured in 20 mM Tris-Cl pH 8.0, 150 mM NaCl, 3 mm DTT, 5% glycerol, 1 mM MgCl2 at 10 °C. Top panel: raw absorbance at 280 nm plotted as a function of the radial position. Data at intervals of 20 min are shown as dots for sedimentation at 40,000 rpm. Middle panel: the residuals between fitted curve and raw data. Bottom panel: the fitted distribution of the apparent sedimentation coefficient (s*) calculated for S:L-terminase is 4.2S (~90% sample) and 2.7S (<10% sample) corresponding to an estimated molecular mass of ~98.6 kDa and ~42.9 kDa, respectively.

