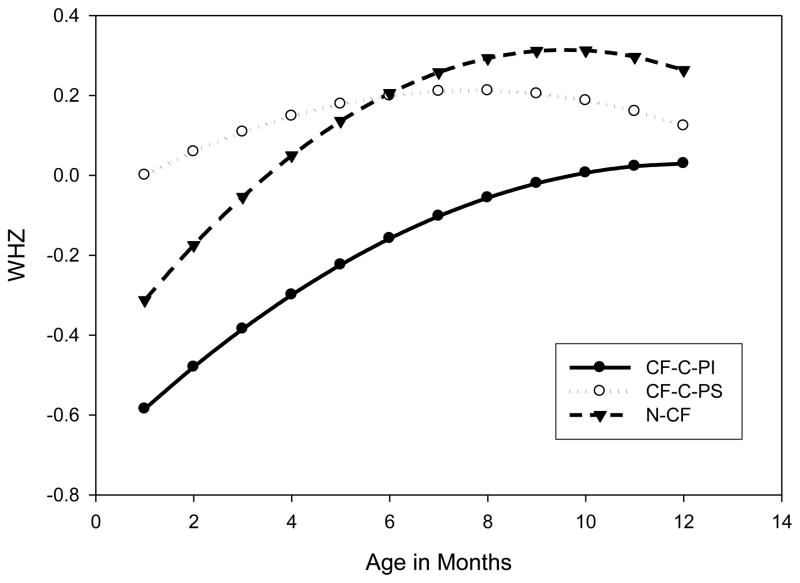
Figure 2. Predicted Weight for Height Z score (WHZ).
by age in months plotted for 3 groups of patients using coefficients derived from a quadratic mixed model. WHZ least squares estimated means±s.e. over 12 months: CF-C-PS 0.11±0.14, CF-C-PI -0.28±0.07, N-CF 0.03±0.13. Analysis by genotype group and pancreatic status; comparison to CF-C-PS (n=37): CF-C-PI (n=138; p=0.023) and N-CF (n=46; p=0.851).
CF-C-PS: CF causing variant group and pancreatic sufficiency; PI=pancreatic insufficiency; and N-CF = Non CF-causing variant group.

