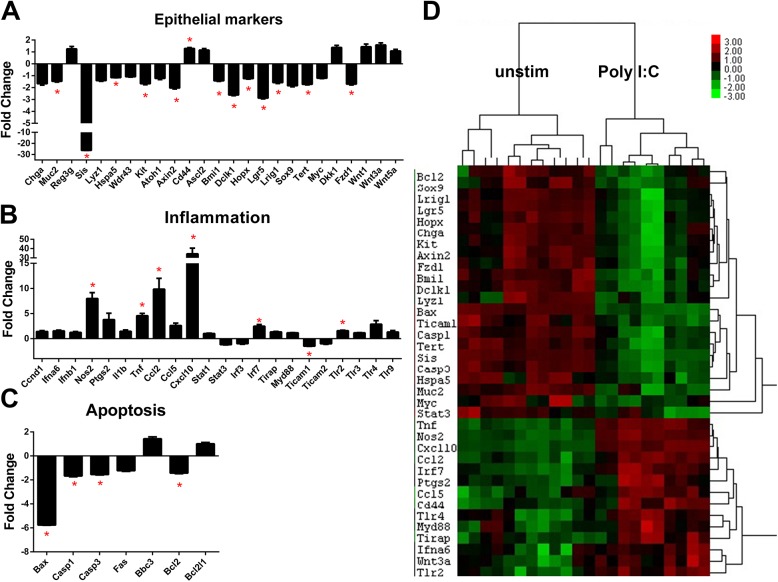
Fig 4. Enteroid gene expression changes induced by Poly I:C stimulation.
Enteroids were grown and stimulated as in Fig 1. Gene expression levels were determined using Nanostring probe-based analysis of isolated RNA. A) Fold change in normalized gene expression are grouped by category. Bars represent mean ±SEM compared to unstimulated samples. n = 5 (Poly I:C stimulation)/6 (unstim) duplicate samples. Discoveries (*) determined by false discovery rate following multiple t-test analysis. B) Heat map of the normalized probe counts of unstimulated and Poly I:C stimulated enteroids of each technical replicate. Samples and genes were clustered by Pearson correlation.

