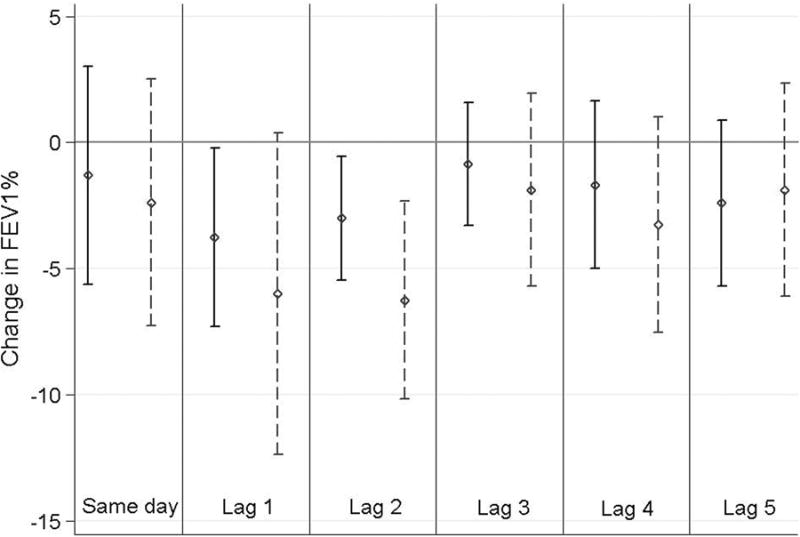
Figure 3.

Associations between FEV1% and ammonia (NH3) concentrations measured at the nearest neighbor monitors. For each lag relationship, results for the entire cohort (solid line) as well as those obtained after restriction to subjects living within 1 km of the nearest monitor (dashed line) are displayed. Point estimates and 95% CI represent changes associated with an IQR increase in 24-hour average ammonia (25 μg/m3). Abbreviations: FEV1% = forced expiratory volume in 1 second as percent of predicted; IQR = interquartile range; GEE = generalized estimating equations; BMI = body mass index; CI = confidence interval
