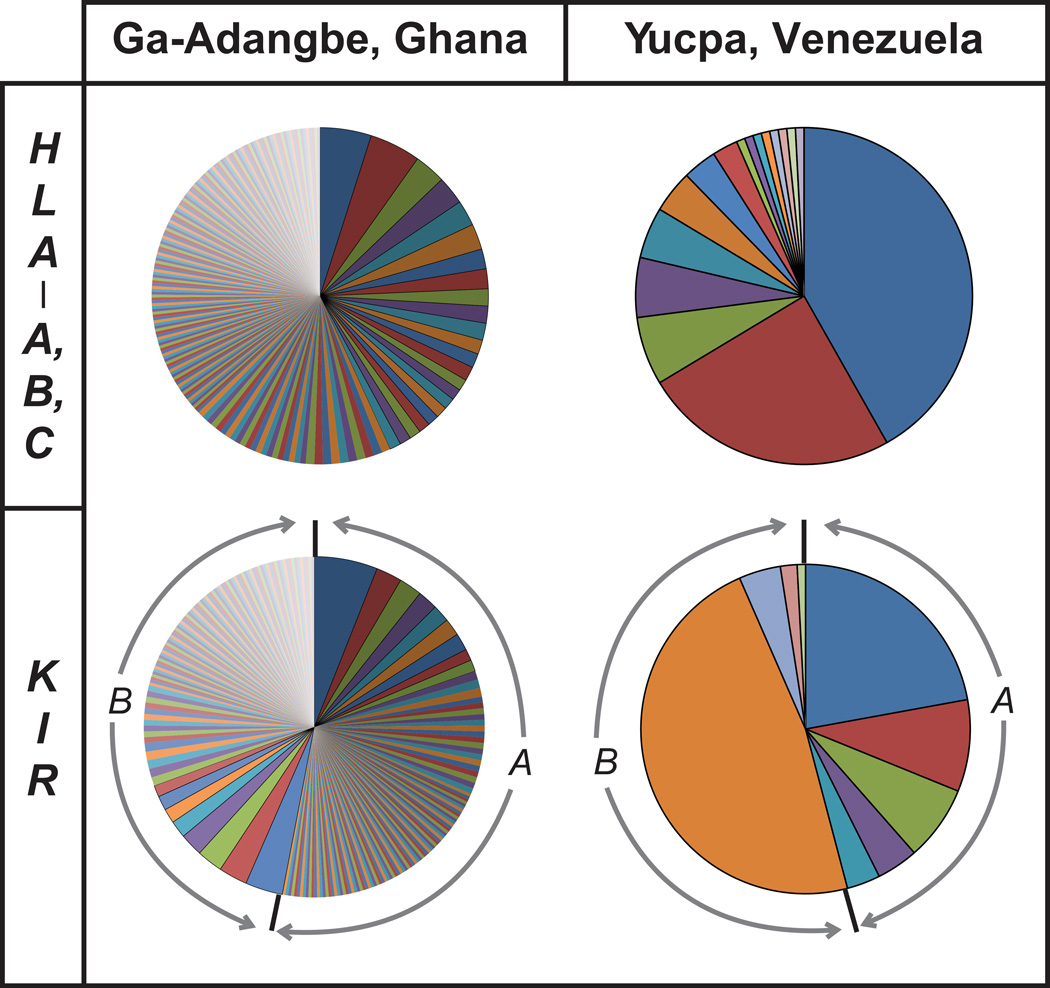
Figure 15. The HLA and KIR diversity of human populations is inversely correlated with the distance from East Africa of their place of origin.
Compared here is an African population, the Ga-Adangbe from Ghana, and a Native American population, the Yucpa from Venezuela. The upper pie charts show the number and frequencies of allele-level HLA-A,-B,-C haplotypes in the two populations. The lower pie charts show the number and frequencies of allele-level KIR haplotypes in the two populations. The proportions of KIR A and KIR B haplotypes are shown by the curved arrows. Based upon the data of Gendzehhadze et al. (Yucpa) (137) and Norman et al (Ga-Adangbe) (25).

