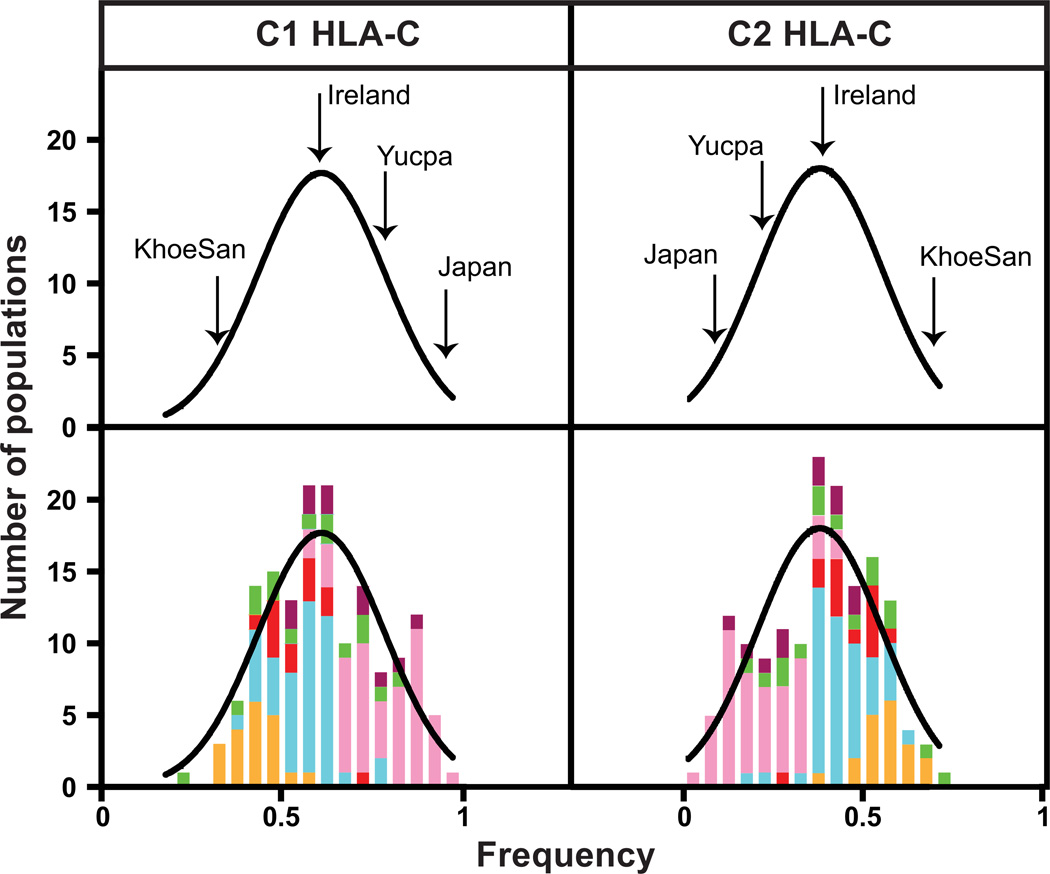
Figure 16. Frequencies of the C1 and C2 epitopes of HLA-C vary among human populations worldwide.
Frequencies of HLA-C alleles for 153 populations were obtained from http://www.allelefrequencies.net (1). All these populations are anthropologically well defined and are represented by samples of more than 40 individuals. Panels from disease-association studies and transplant cohorts, for which frequency skewing was a possibility, were excluded. Population frequencies were binned in increments of .05 and plotted. The curve approximating the frequency distribution was plotted using Prism 6. Frequencies for C1-bearing HLA-C allotypes are shown on the left; frequencies for C2-bearing HLA-C allotypes are on the right. The upper panels show the frequency distributions for four populations representing Africa (KhoeSan), Europe (Northern Ireland), Asia (Japan), and America (Yucpa) indicated by vertical arrows. The lower panels show the same curves as the upper panels, but they also include the histograms showing the distribution of different population groups. The bars are colored as in Fig. 14: Africans; orange, European/Middle Eastern; blue, Indian; red, East Asian; pink, Oceanian; green, and Native American; purple. Within the global distribution, regional differences can be observed. For example, Africans have higher C2 frequencies than other population groups, whereas East Asians stand out for their higher C1 frequencies.

