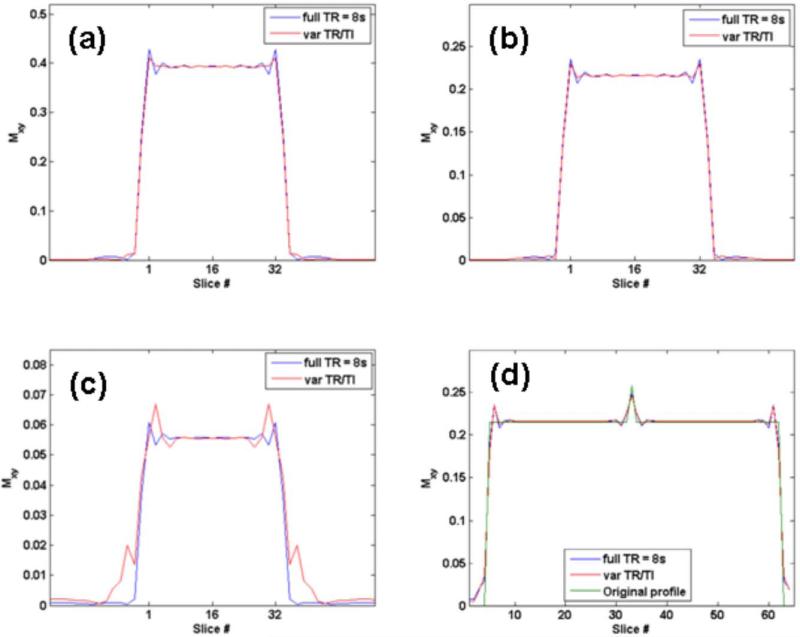
Figure 4.
Change in slab profile for (a) gray matter (b) white matter and (c) CSF obtained with the two different 3D FLAIR implementations using full TR = 8s and variable TR and TI. Figure 4(d) shows the simulated case of a hyperintense (20% higher) signal in a single pixel (pixel 33) in white matter along the z direction. Equally good conspicuity for 3D FLAIR and 3D mFLAIR sequence can be seen. The original profile is also shown.

