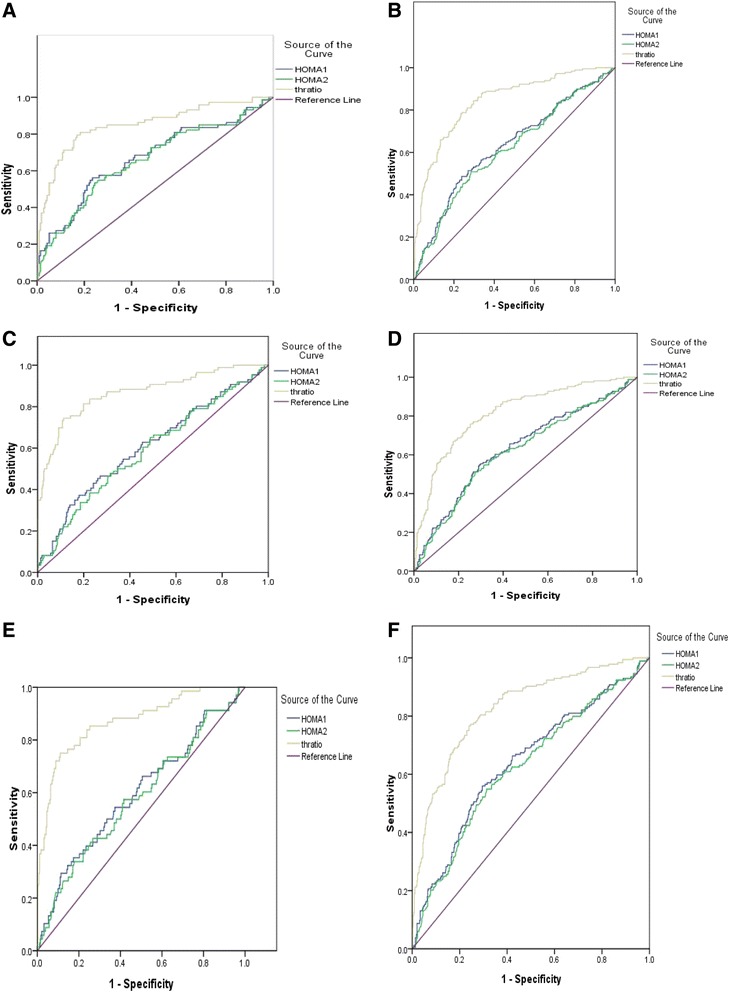
Fig. 1.

ROC comparisons of HOMA-IR and TG/HDL-C stratified by sex, age group and pubertal stage. AUC-ROC Z statistic for pairwise comparison of AUC: HOMA1-IR = HOMA2-IR, p > 0.05; HOMA1-IR < TG/HDL-C, p < 0.05; HOMA2-IR < TG/HDL-C, p < 0.05; When stratified by sex a female, b male; age group c (<10 years), d (> = 10 years); pubertal stage (pre-pubertal stage) (e), (pubertal stage) (f)
