Figure 1.
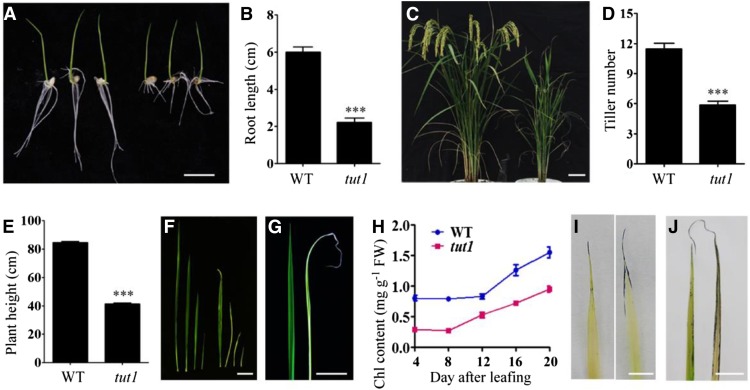
Phenotypes of tut1. A, Seedling phenotype of the wild type (cv Zhonghua 11, left three seedlings) and tut1 (right three seedlings). Seeds were germinated at 30°C for 3 d and then transferred to a culture chamber with a 16-h/8-h photoperiod at 30°C. Bar = 1 cm. B, Statistical analysis of root length in the wild type (WT) and tut1 as shown in A. The data presented are mean values of two independent experiments (n > 45). Error bars indicate sd; ***, P < 0.01 (Student’s t test). C, Phenotypes of wild-type (left) and tut1 (right) mutants at the grain-filling stage. Bar = 5 cm. D and E, Statistical analysis of tiller number and plant height at maturity of the wild type and tut1. The data presented are mean values (n > 50). Error bars indicate sd; ***, P < 0.01 (Student’s t test). F, Leaves of the wild type (left four leaves) and tut1 (right four leaves) at different growth stages. Bar = 5 cm. G, Leaves of the wild type (left) and tut1 (right) at 10 d after leafing. Bar = 2 cm. H, Analysis of chlorophyll (Chl) content of wild-type and tut1 leaves at different times after leafing. Blue line indicates the wild type, red line indicates tut1. Leaves at 4, 8, 12, 16, and 20 d after leafing were used in the analysis. Fresh leaves were used for measurement of chlorophyll contents. Two technical repeats were made in the test. Error bars indicate sd. I, Cell death analysis of wild-type (left) and tut1 (right) seedling leaves using Evans blue staining. Bar = 0.5 cm. J, ROS observation of wild-type (left) and tut1 (right) mature leaves using nitroblue tetrazolium (NBT) staining. FW, Fresh weight. Bar = 2 cm.

