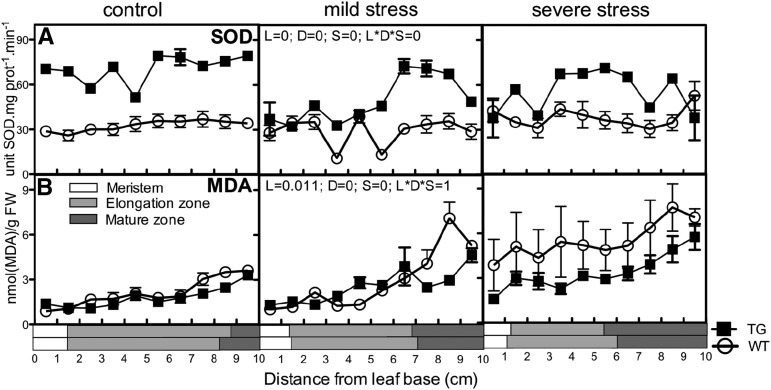
Figure 5.
SOD activity and MDA levels in the leaf growth zone of the P35S:ATFeSOD line and its wild type. Biochemical determination of SOD activity (A) and MDA levels (B) was done in the growing zone of maize leaves from control (well-watered) plants and plants exposed to mild and severe water stress, comparing wild-type (WT) and 35S-AtFESOD transgenic (TG) lines. A three-way ANOVA was used as a statistical test, and P values for the three factors, line (L), drought (D), and segment (S), as well as the interaction between them (L*D*S), are present on the middle graph for each band. Data are averages ± se (n = 3). The length of each developmental zone (meristem, elongation, and mature) is marked on the x axes of the graphs for each line (wild type and transgenic). FW, Fresh weight.

