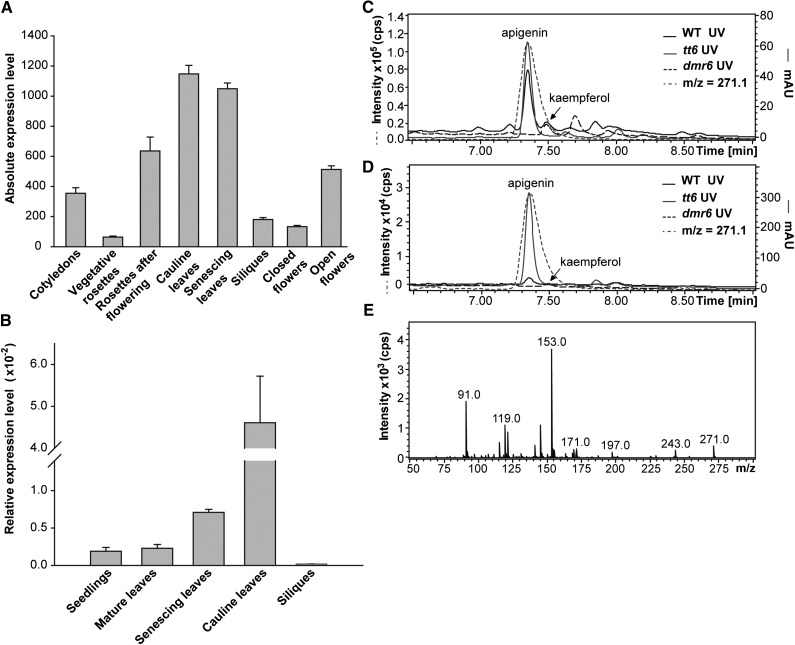
Figure 8.
AtDMR6 expression analysis and accumulation of apigenin in Arabidopsis. A, AtDMR6 expression levels during plant development. Microarrays data were retrieved from the Arabidopsis eFP Browser (Winter et al., 2007). B, AtDMR6 expression levels in different Arabidopsis tissues determined by RT-quantitative PCR (qPCR). The relative AtDMR6 transcript abundance was analyzed in seedlings (2 weeks old), mature leaves (4 weeks old), senescing leaves (42 d after pollination [DAP]), cauline leaves, and siliques. Each reaction was normalized using the cycle threshold values corresponding to the UBIQUITIN10 (UBQ10) mRNA. The means of the results obtained using three independent RNAs as templates are shown, and the error bars indicate sd. C and D, UV light and ion chromatogram profiles of hydrolyzed flavonoids of cauline (C) and senescing (D) leaves from wild-type (WT), tt6, and dmr6 Arabidopsis plants analyzed by LC-MS/MS showing the m/z = 271 molecular ion in wild-type and tt6 plants that corresponds to apigenin. The peak at 7.5 min that corresponds to kaempferol is also indicated. mAU, Milliabsorbance units. E, MS/MS fragmentation profile of the detected peaks with the molecular ion of m/z = 271.

