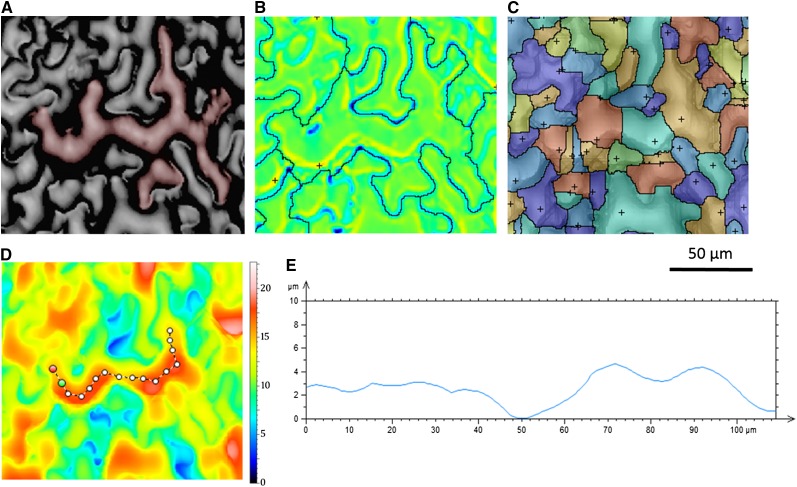
Figure 6.
Motif operator identifies both cells and lobes. A, Reflective intensity of Arabidopsis epidermis with false color of a single cell. B, Motif operator identification of the cell using relaxed parameters. C, Motif operator identification of lobes within the cell using conservative parameters. D, Transect measuring height across the cell. Color bar indicates height in micrometers. E, Graph of difference in height along transect. The motif analysis for rop2 can be found in Supplemental Figure S2.

