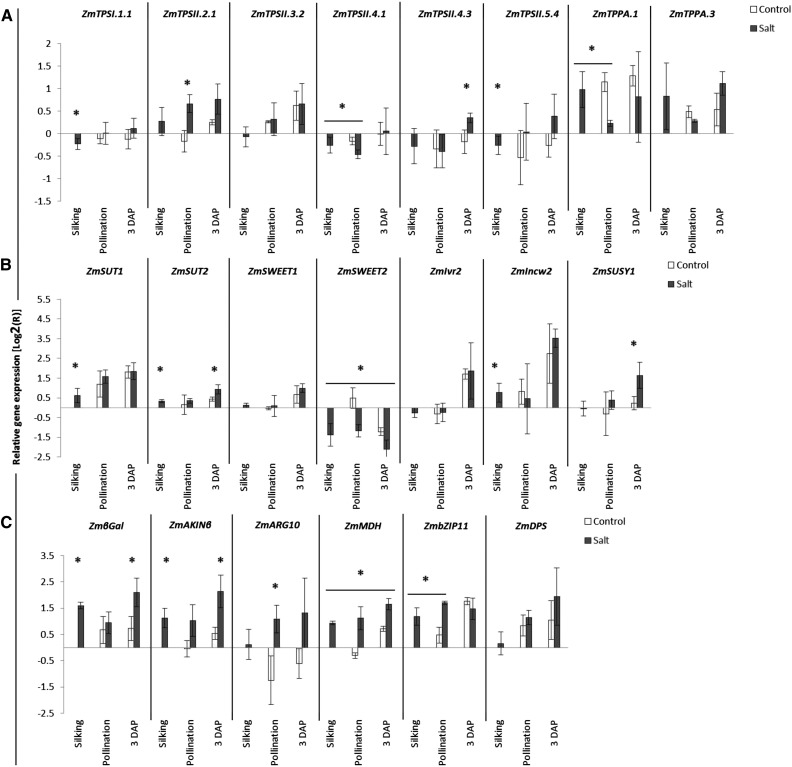
Figure 10.
Relative mRNA levels in cob tissue for trehalose biosynthetic genes (A), carbohydrate metabolism genes (B), and sugar transport genes (C). Transcript levels were determined by qRT-PCR in control and salt-stressed plants at silking, pollination, and 3 DAP. Plants were grown as described in “Materials and Methods.” Results are expressed relative to the average levels of three stably expressed genes (PP2AA-2, GAPDH1, and Fbox3). Asterisks indicate that salt treatment had a significant effect over controls (P < 0.05; n = 3).

