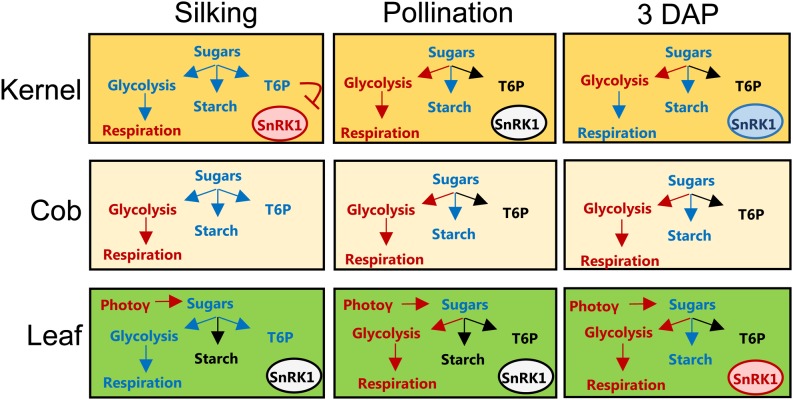
Figure 12.
Model depicting the metabolic effects of salt treatment on flowering maize plants at silking, pollination, and 3 DAP. Tissues represented are kernel, cob, and leaf. Watering with 150 mm NaCl results in either no effect (black), decreased levels (red), or increased levels (blue). Photoγ, Photosynthesis.

