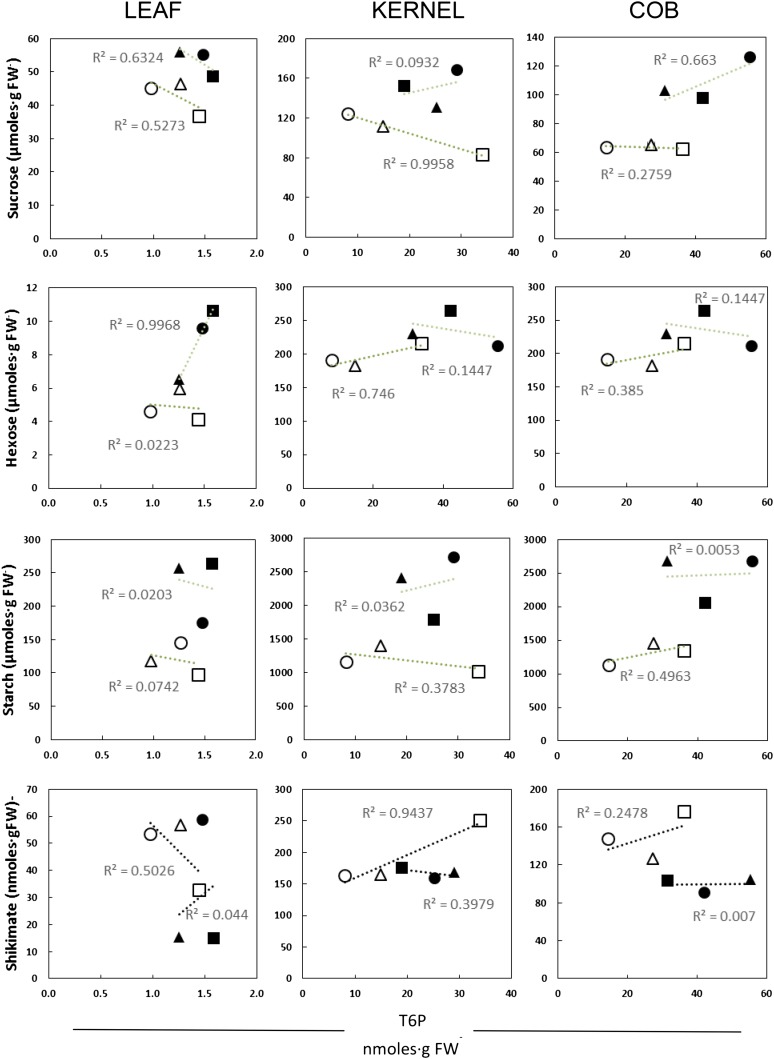
Figure 6.
Correlations between T6P and key metabolites. Linear regression analysis was performed to compare T6P levels (x axis) with the key metabolites Suc, hexoses, starch, and shikimate (y axis). Plant stages are indicated as follows: circles, silking; triangles, pollination; and squares, 3 DAP. Control (white markers) and salt-treated (black markers) plants are represented. Moderate correlation (r2 > 0.5) and high correlation (r2 > 0.9) were found. FW, Fresh weight.

